Fig. A.1.
Download original image
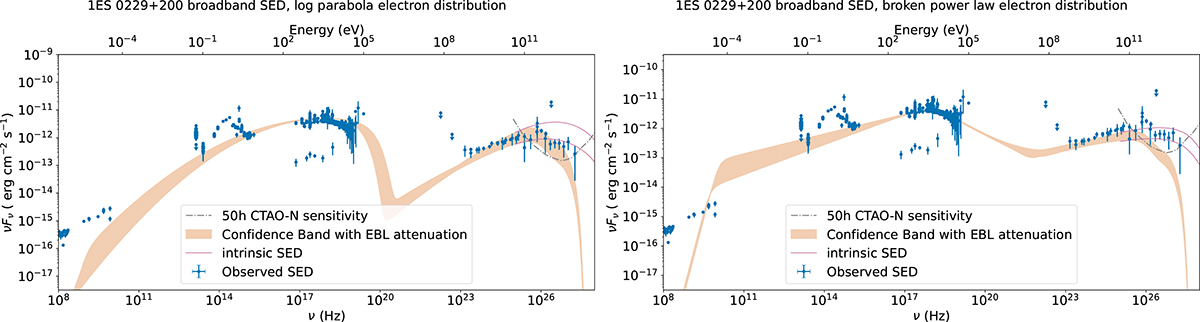
Broadband SED of 1ES 0229+200 (z = 0.139, γ0 ∼ 105, γbreak ∼ 106). The data points in blue are those available from past observations, while the upper limits in green are derived from Fermi data. The regions in orange are the one-zone models, assuming on the left a log parabola distribution, and on the right a broken power-law distribution for the electron population and EBL attenuation according to Domínguez et al. (2024). Additionally, pink lines show how the intrinsic models would behave without EBL attenuation, while in grey we show the sensitivity of the CTAO-N array in survey mode for a 50-hour observation at zenith 20°.
Current usage metrics show cumulative count of Article Views (full-text article views including HTML views, PDF and ePub downloads, according to the available data) and Abstracts Views on Vision4Press platform.
Data correspond to usage on the plateform after 2015. The current usage metrics is available 48-96 hours after online publication and is updated daily on week days.
Initial download of the metrics may take a while.