Fig. 8
Download original image
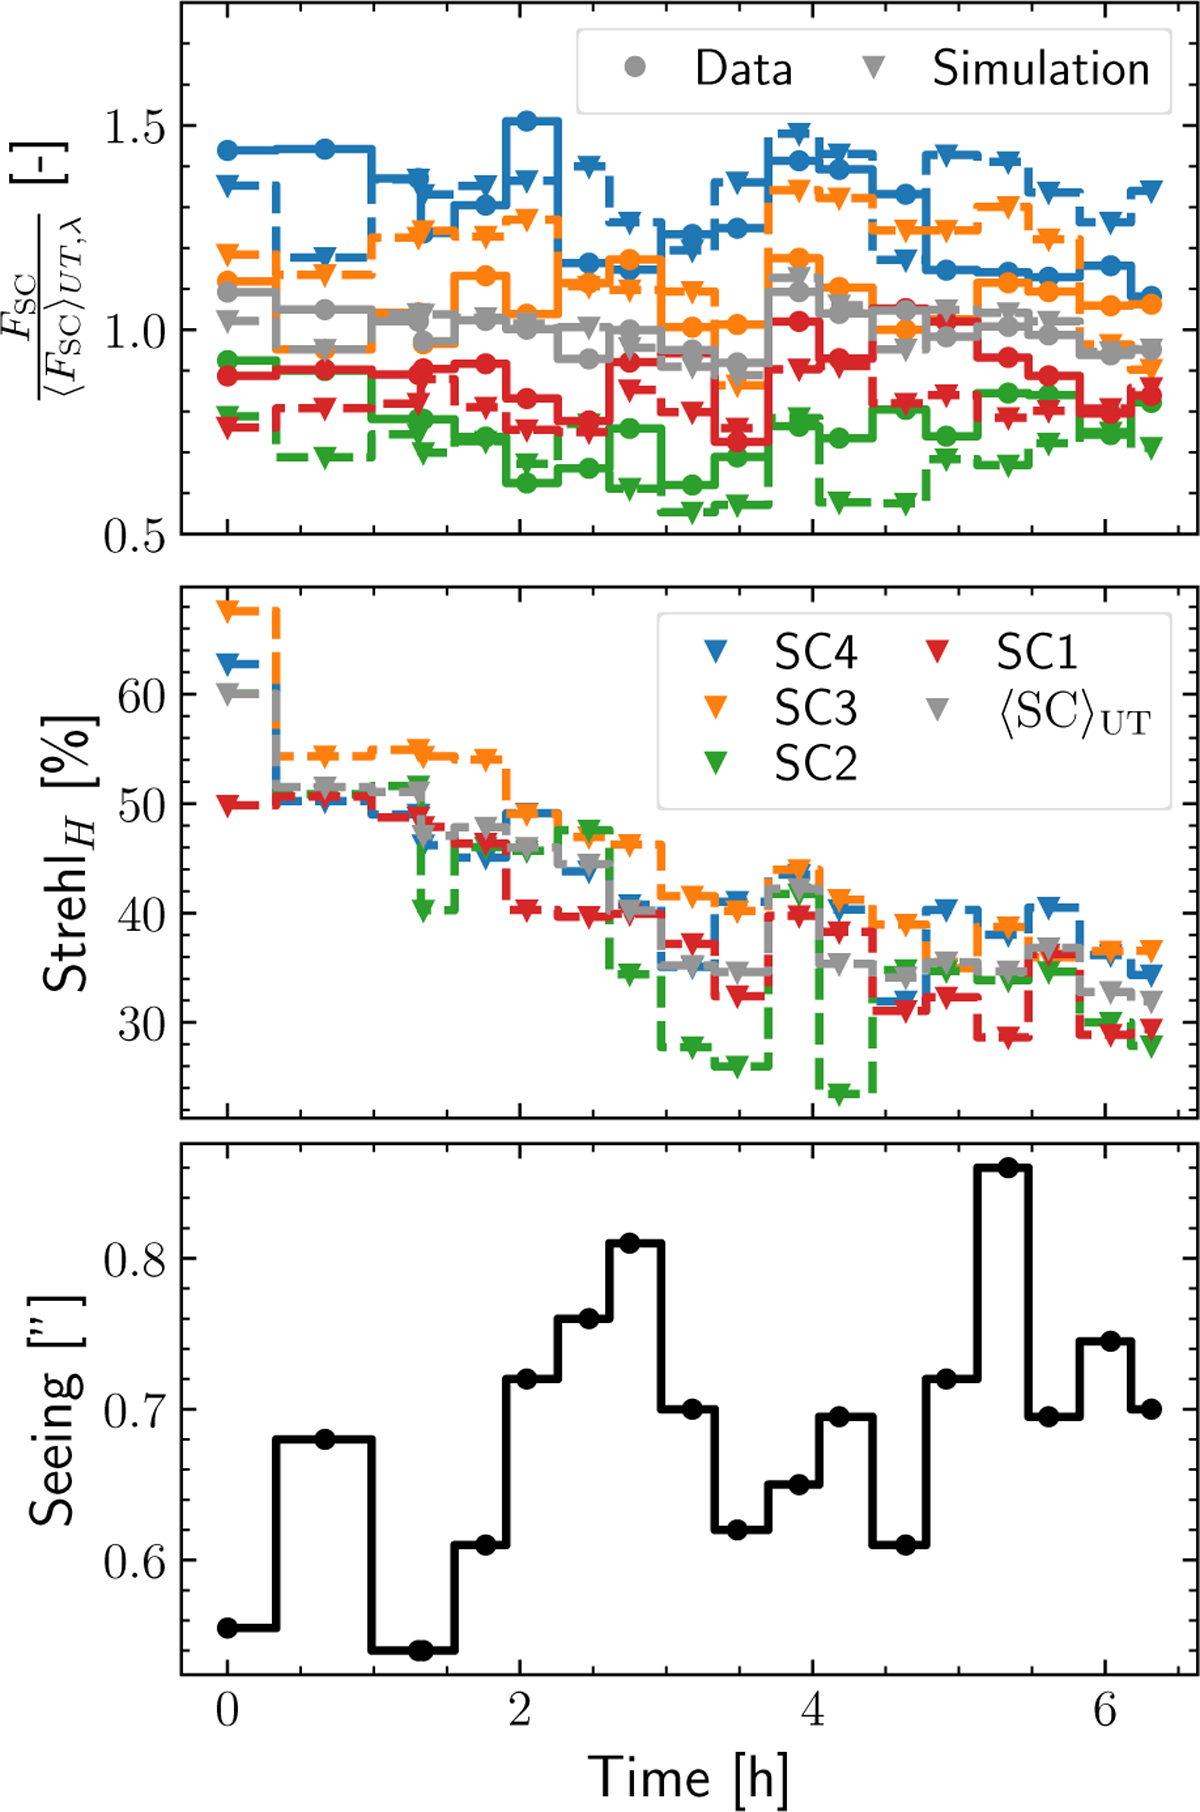
Top: measured (dots, solid lines) and simulated (triangles, dashed lines) relative SC fluxes of the four UTs (4, ..., 1) and their average (different colors) for all exposures during the observation. Center: respective H-band Strehl ratios derived from focal-plane wavefront sensing. Bottom: recorded seeing during the observing night.
Current usage metrics show cumulative count of Article Views (full-text article views including HTML views, PDF and ePub downloads, according to the available data) and Abstracts Views on Vision4Press platform.
Data correspond to usage on the plateform after 2015. The current usage metrics is available 48-96 hours after online publication and is updated daily on week days.
Initial download of the metrics may take a while.