Fig. 6
Download original image
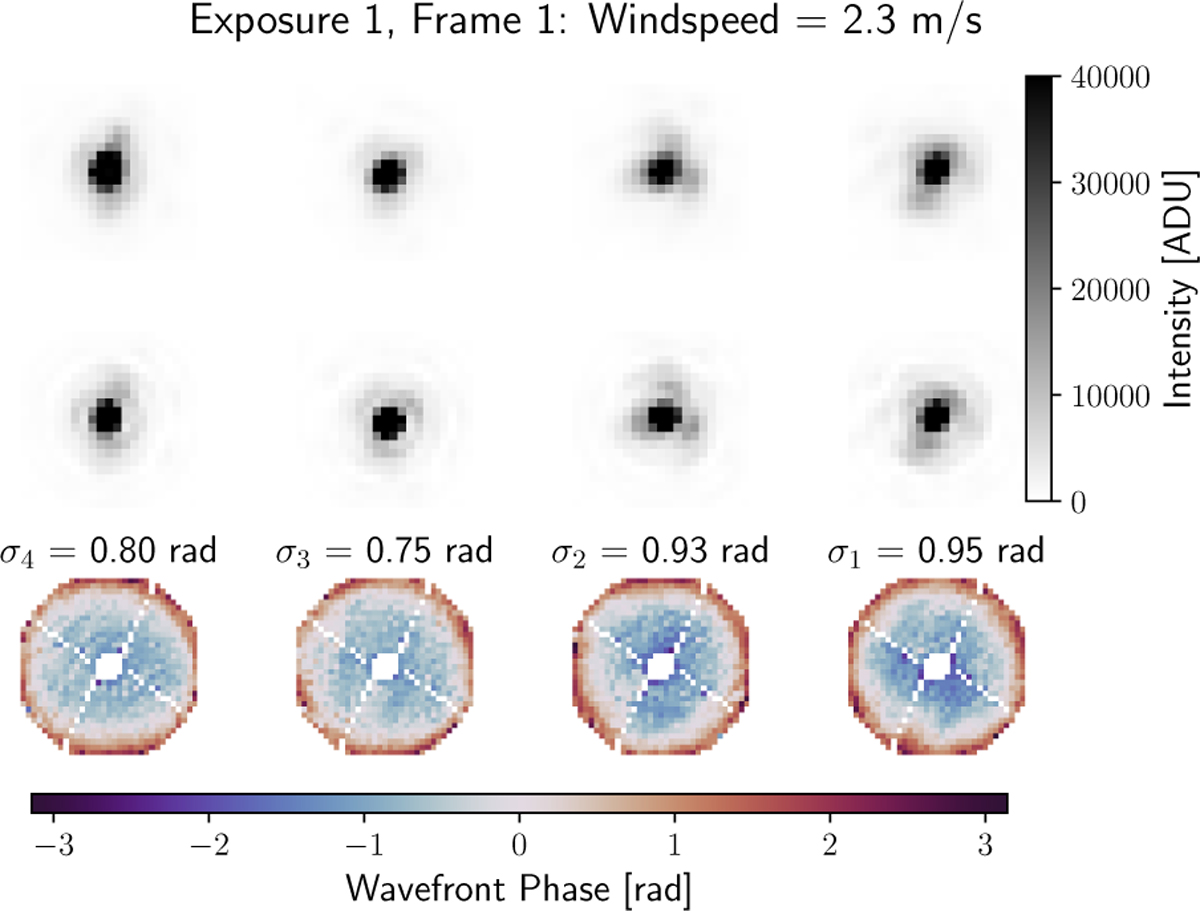
Top: example PSF frames of the four UTs (from left to right: 4, ..., 1) from the acquisition camera at moderate wind speed, saturated at 40 000 ADU. Center: PSF fits to the data. Bottom: retrieved tip-tilt-subtracted wavefronts from the PSF fits. The wavefront errors are measured using the standard deviation. The associated movie is available online.
Current usage metrics show cumulative count of Article Views (full-text article views including HTML views, PDF and ePub downloads, according to the available data) and Abstracts Views on Vision4Press platform.
Data correspond to usage on the plateform after 2015. The current usage metrics is available 48-96 hours after online publication and is updated daily on week days.
Initial download of the metrics may take a while.