Fig. A.1
Download original image
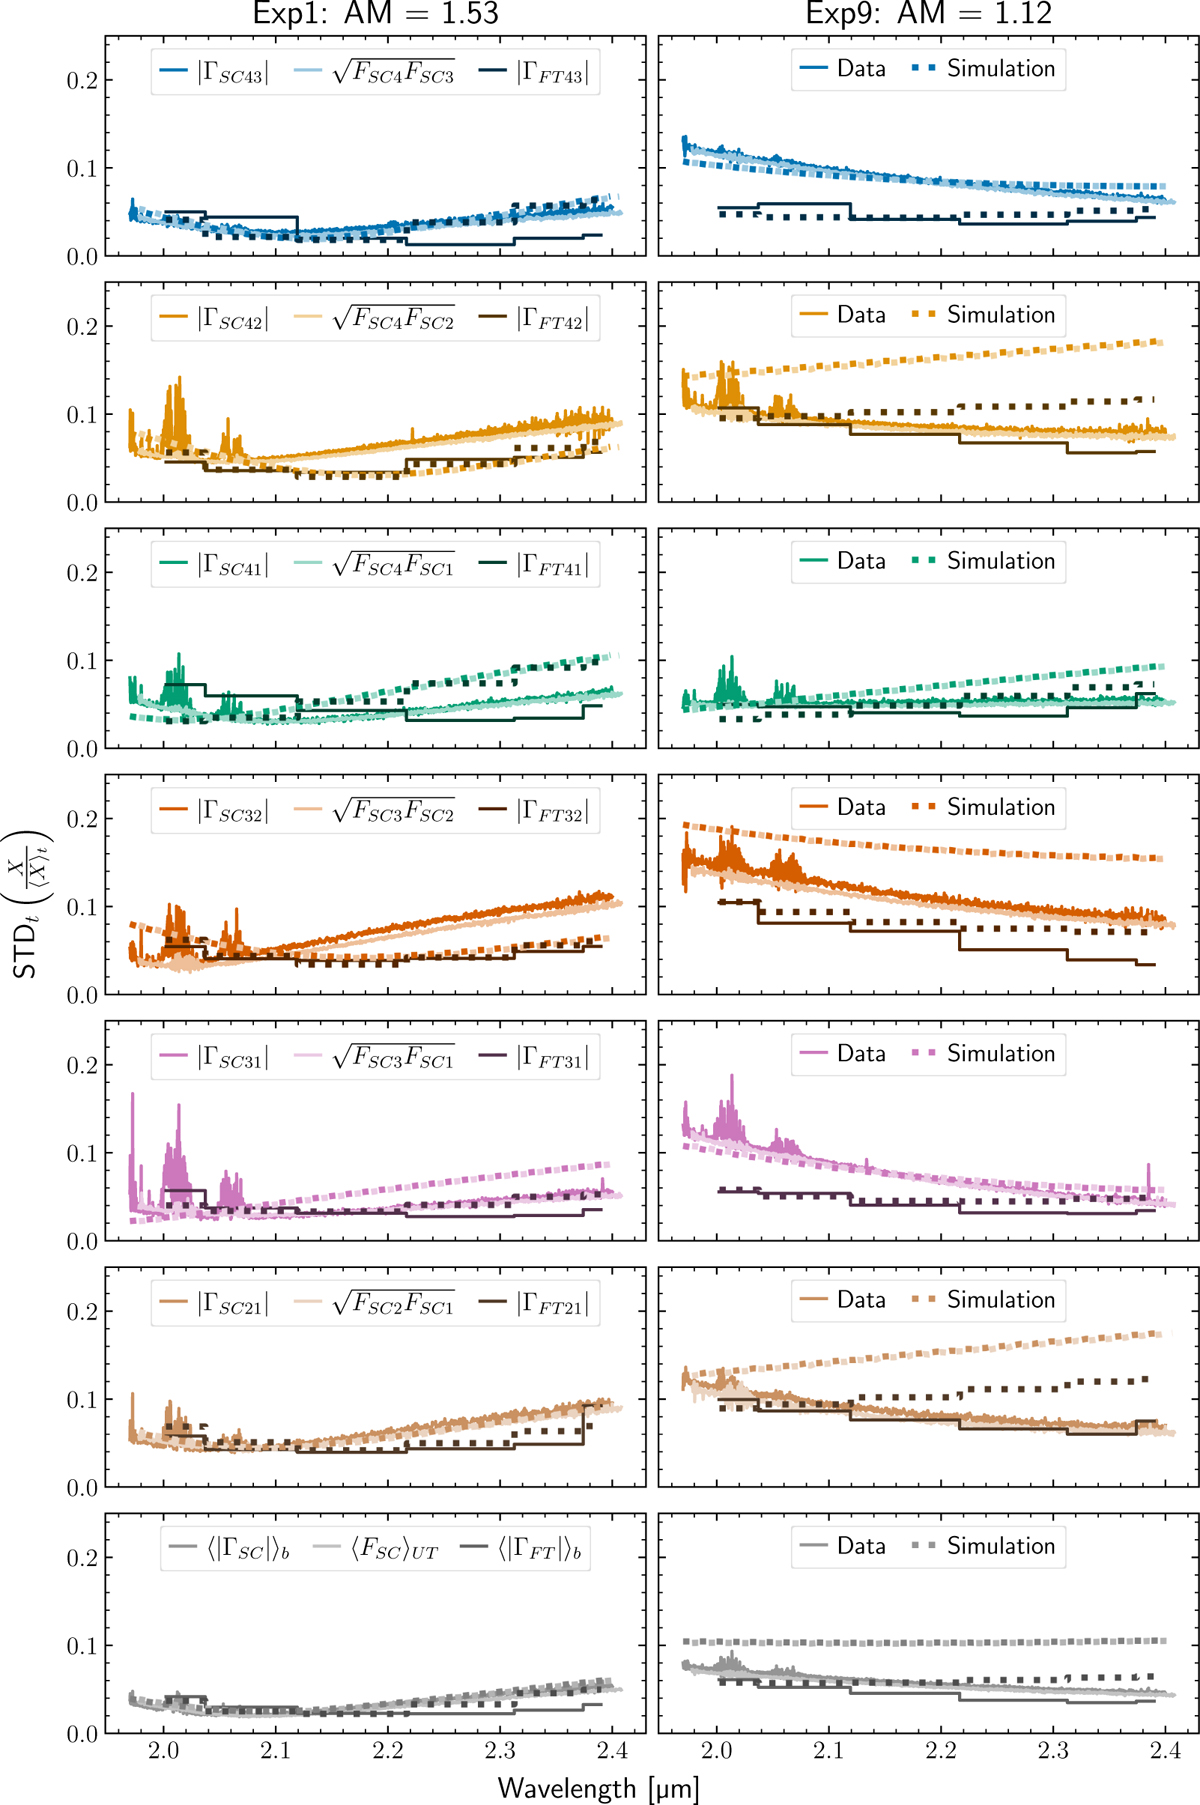
Left: Standard deviation (STD) of the measured (solid lines) and simulated (dotted lines) relative SC (1628 spectral bins) absolute coherent fluxes |ΓSC43|, ..., |ΓSC21|, combined SC fluxes ![]() , and FT (6 spectral bins) absolute coherent fluxes |ΓFT43|, ..., |ΓFT21| (different shades) for an example exposure at high airmass, shown for the six baselines (43, ..., 21) and their respective baseline averages ⟨·⟩b (different colors from top to bottom). Right: Same as the left panels but for an exposure at low airmass.
, and FT (6 spectral bins) absolute coherent fluxes |ΓFT43|, ..., |ΓFT21| (different shades) for an example exposure at high airmass, shown for the six baselines (43, ..., 21) and their respective baseline averages ⟨·⟩b (different colors from top to bottom). Right: Same as the left panels but for an exposure at low airmass.
Current usage metrics show cumulative count of Article Views (full-text article views including HTML views, PDF and ePub downloads, according to the available data) and Abstracts Views on Vision4Press platform.
Data correspond to usage on the plateform after 2015. The current usage metrics is available 48-96 hours after online publication and is updated daily on week days.
Initial download of the metrics may take a while.