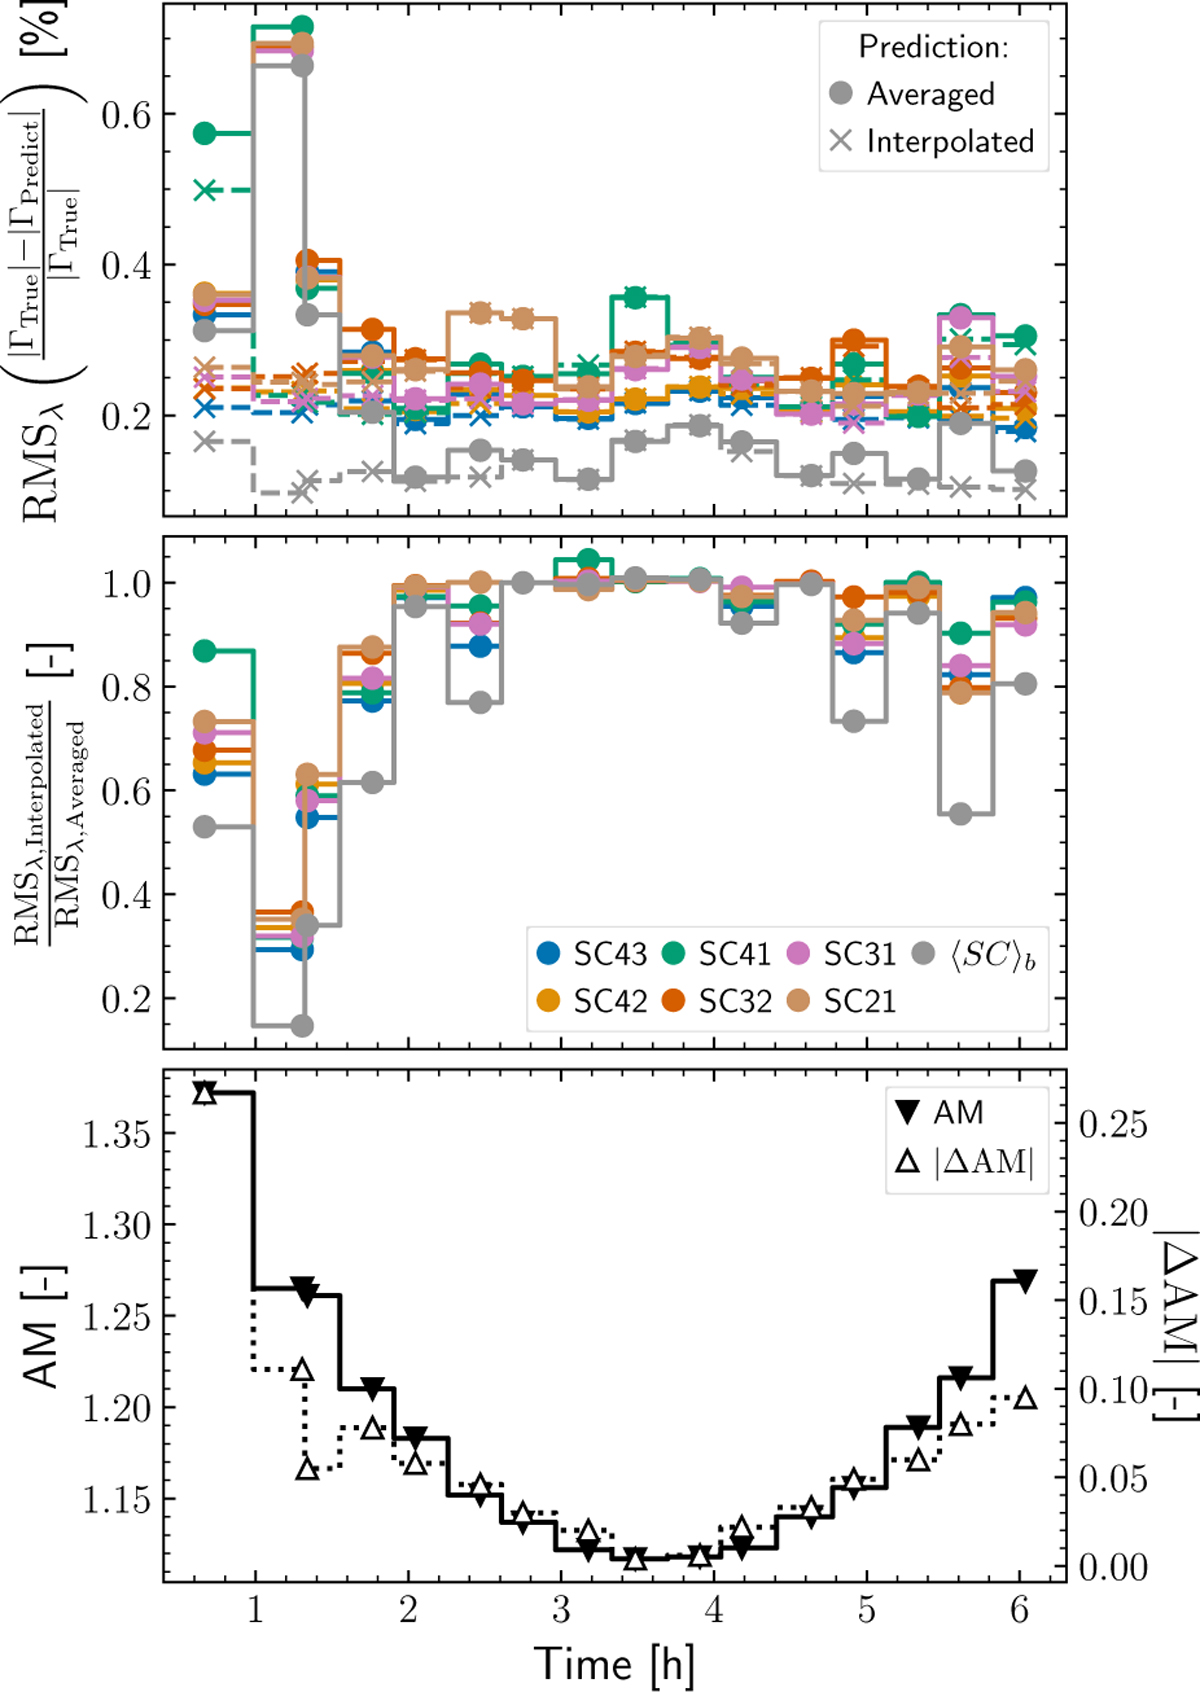
Fig. 12
Download original image
Top: wavelength RMS of the relative difference between the measured True and Predicted absolute coherent flux as a function of time. The RMS values are shown for each interferometric baseline and for the baseline average (different colors), and are computed for each on-star exposure with at least one preceding and subsequent calibration exposure, using averaging (dots, solid lines) and interpolation (crosses, dashed lines) approaches. Center: ratio between the RMS obtained with the averaging and interpolation methods for each exposure. Bottom: airmass (filled triangles, solid lines) at the time of observation and absolute airmass difference (open triangles, dotted lines) between the preceding and subsequent calibration exposures. Because the observations are obtained at approximately constant time intervals, the airmass differences are strongly correlated with the airmass.
Current usage metrics show cumulative count of Article Views (full-text article views including HTML views, PDF and ePub downloads, according to the available data) and Abstracts Views on Vision4Press platform.
Data correspond to usage on the plateform after 2015. The current usage metrics is available 48-96 hours after online publication and is updated daily on week days.
Initial download of the metrics may take a while.