Fig. 11
Download original image
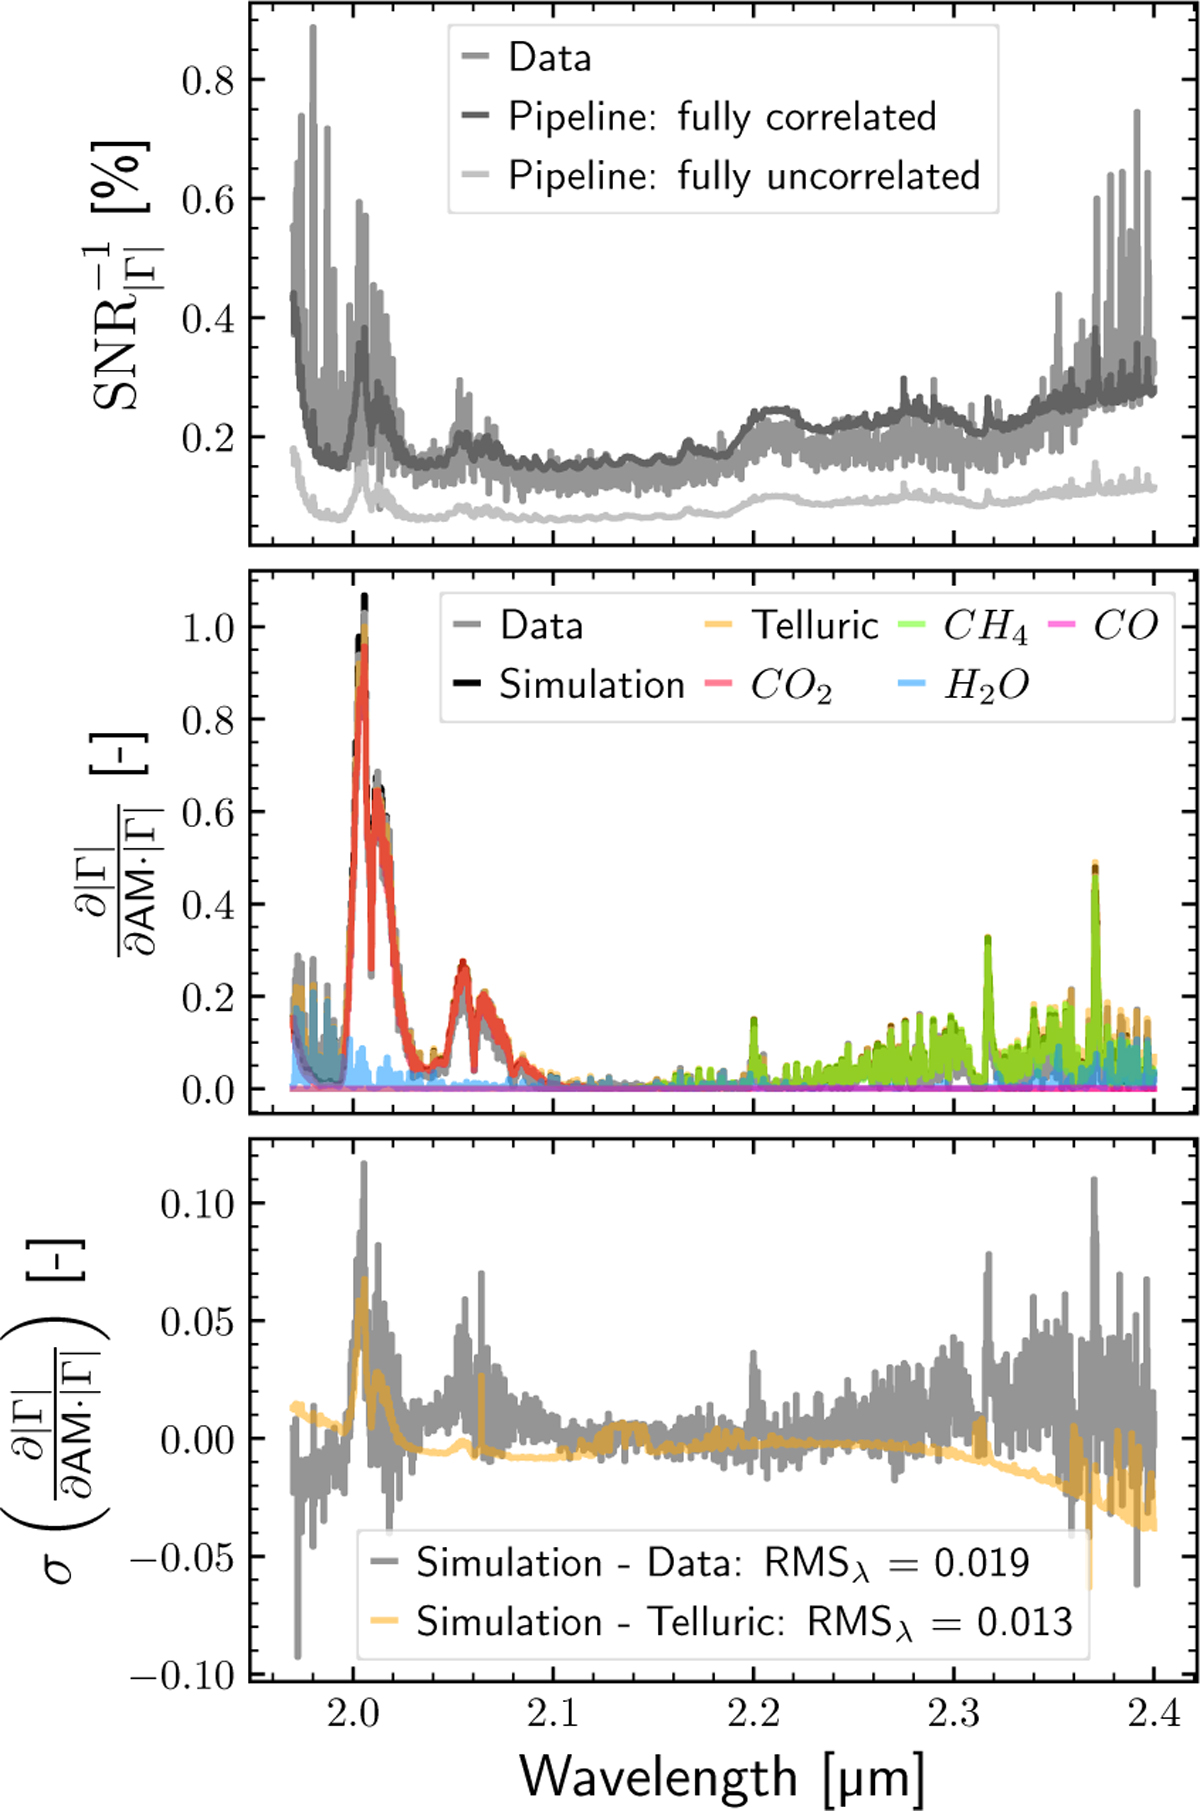
Top: relative absolute coherent flux noise as a function of wavelength, measured in the data and estimated by the GRAVITY pipeline assuming fully correlated and uncorrelated baselines. Center: relative absolute coherent flux slopes as a function of wavelength for the data, the simulations, and the pure telluric models, including their respective molecular contributions. Bottom: residuals of the relative absolute coherent flux slopes between the simulations, the data, and the telluric models.
Current usage metrics show cumulative count of Article Views (full-text article views including HTML views, PDF and ePub downloads, according to the available data) and Abstracts Views on Vision4Press platform.
Data correspond to usage on the plateform after 2015. The current usage metrics is available 48-96 hours after online publication and is updated daily on week days.
Initial download of the metrics may take a while.