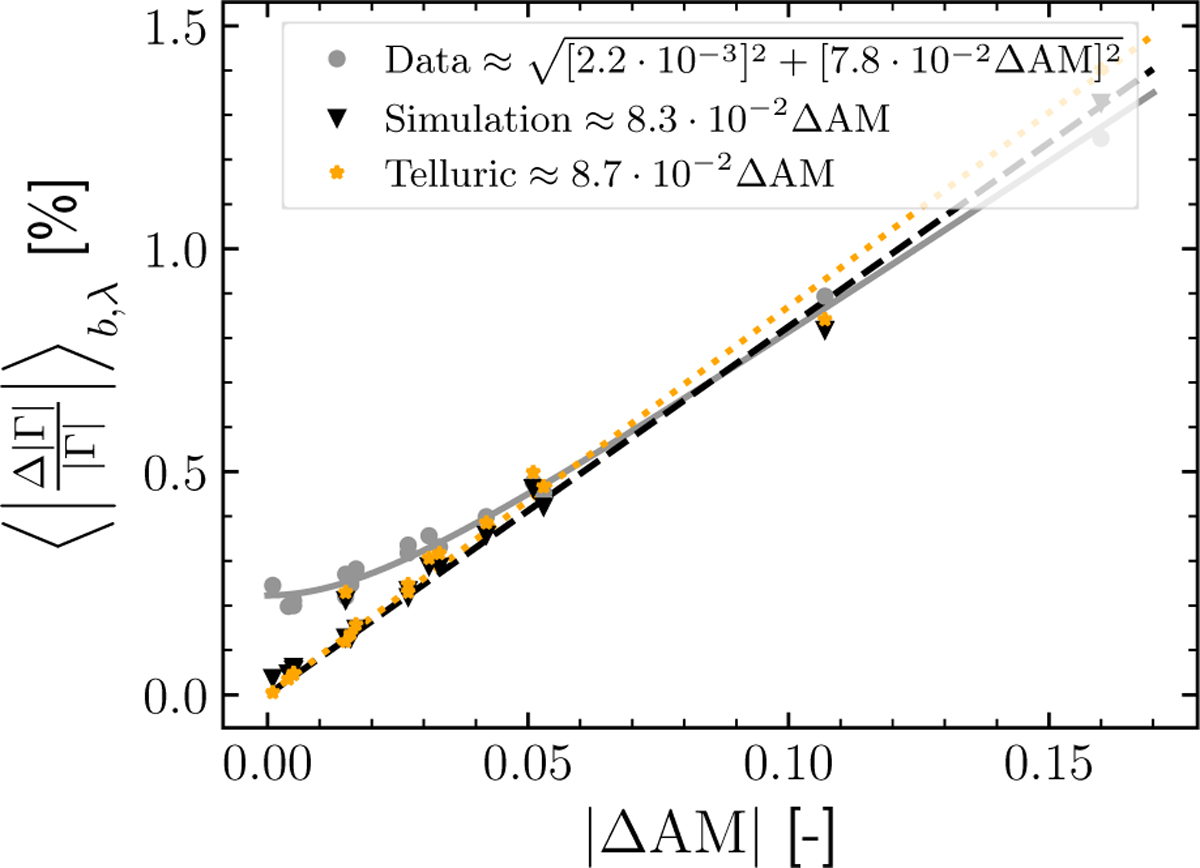
Fig. 10
Download original image
Baseline- and wavelength-averaged relative absolute coherent flux change between two subsequent stellar pointings, shown as a function of absolute airmass change. The simulations (triangles, dashed lines) and the pure telluric models (stars, dotted lines) do not include noise, which results in a linear behavior. For the data (dots, solid lines), the flux change instead converges toward the noise floor at small airmass changes.
Current usage metrics show cumulative count of Article Views (full-text article views including HTML views, PDF and ePub downloads, according to the available data) and Abstracts Views on Vision4Press platform.
Data correspond to usage on the plateform after 2015. The current usage metrics is available 48-96 hours after online publication and is updated daily on week days.
Initial download of the metrics may take a while.