Fig. 9
Download original image
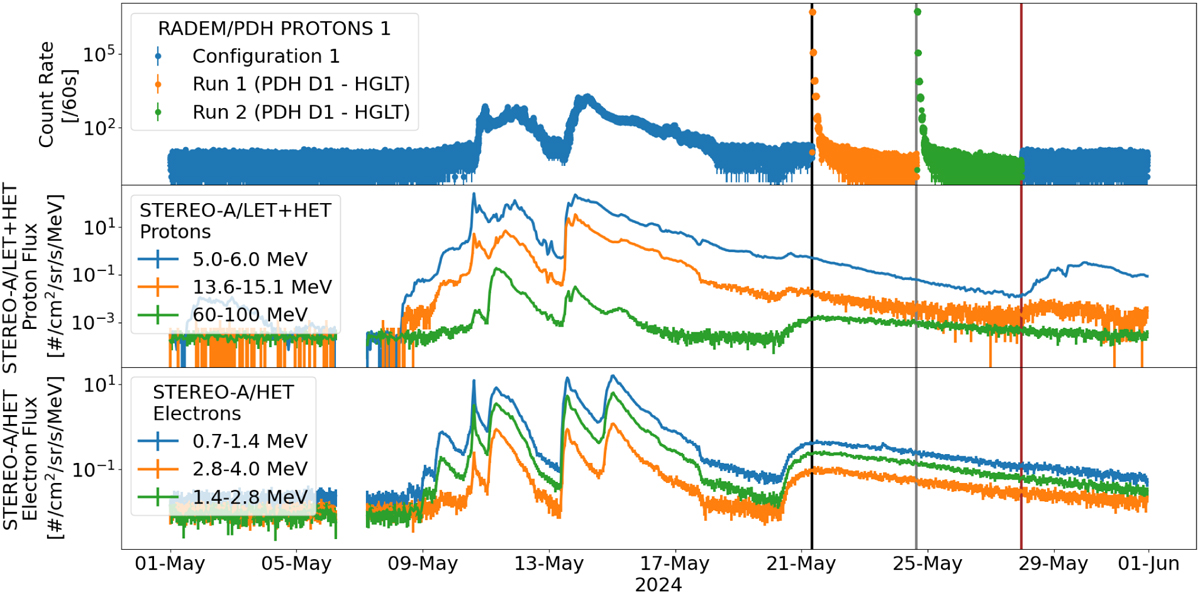
Count rates in the RADEM PROTONS 1 detection bin (top), and proton (middle) and electron (bottom) fluxes for selected energies measured by the STEREO-A LET (protons only) and HET instruments in May 2024. Vertical lines represent the beginning of Run 1 (black), the start of Run 2 (grey), and the end of the calibration scan (red). The colours in each panel correspond simply to different detections and have no relation between panels.
Current usage metrics show cumulative count of Article Views (full-text article views including HTML views, PDF and ePub downloads, according to the available data) and Abstracts Views on Vision4Press platform.
Data correspond to usage on the plateform after 2015. The current usage metrics is available 48-96 hours after online publication and is updated daily on week days.
Initial download of the metrics may take a while.