Fig. 7
Download original image
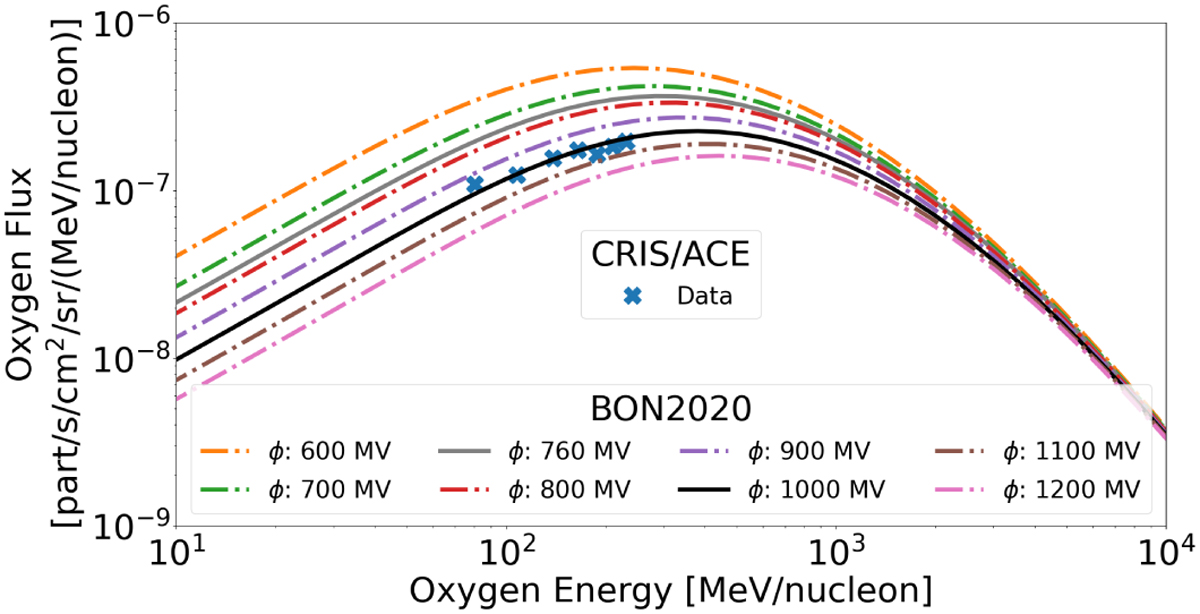
GCR oxygen differential flux computed by the BON2020 model (dotted dashed lines) for different modulation potentials. The grey and black lines show the spectra obtained using the modulation potentials calculated using neutron monitor and CRIS data for May 2024 (RADEM calibration campaign period), respectively. The ACE-CRIS oxygen flux measurements during the same period are shown as blue points. A modulation factor of 1000 MV was found to be in much better agreement with flight observations.
Current usage metrics show cumulative count of Article Views (full-text article views including HTML views, PDF and ePub downloads, according to the available data) and Abstracts Views on Vision4Press platform.
Data correspond to usage on the plateform after 2015. The current usage metrics is available 48-96 hours after online publication and is updated daily on week days.
Initial download of the metrics may take a while.