Fig. 15
Download original image
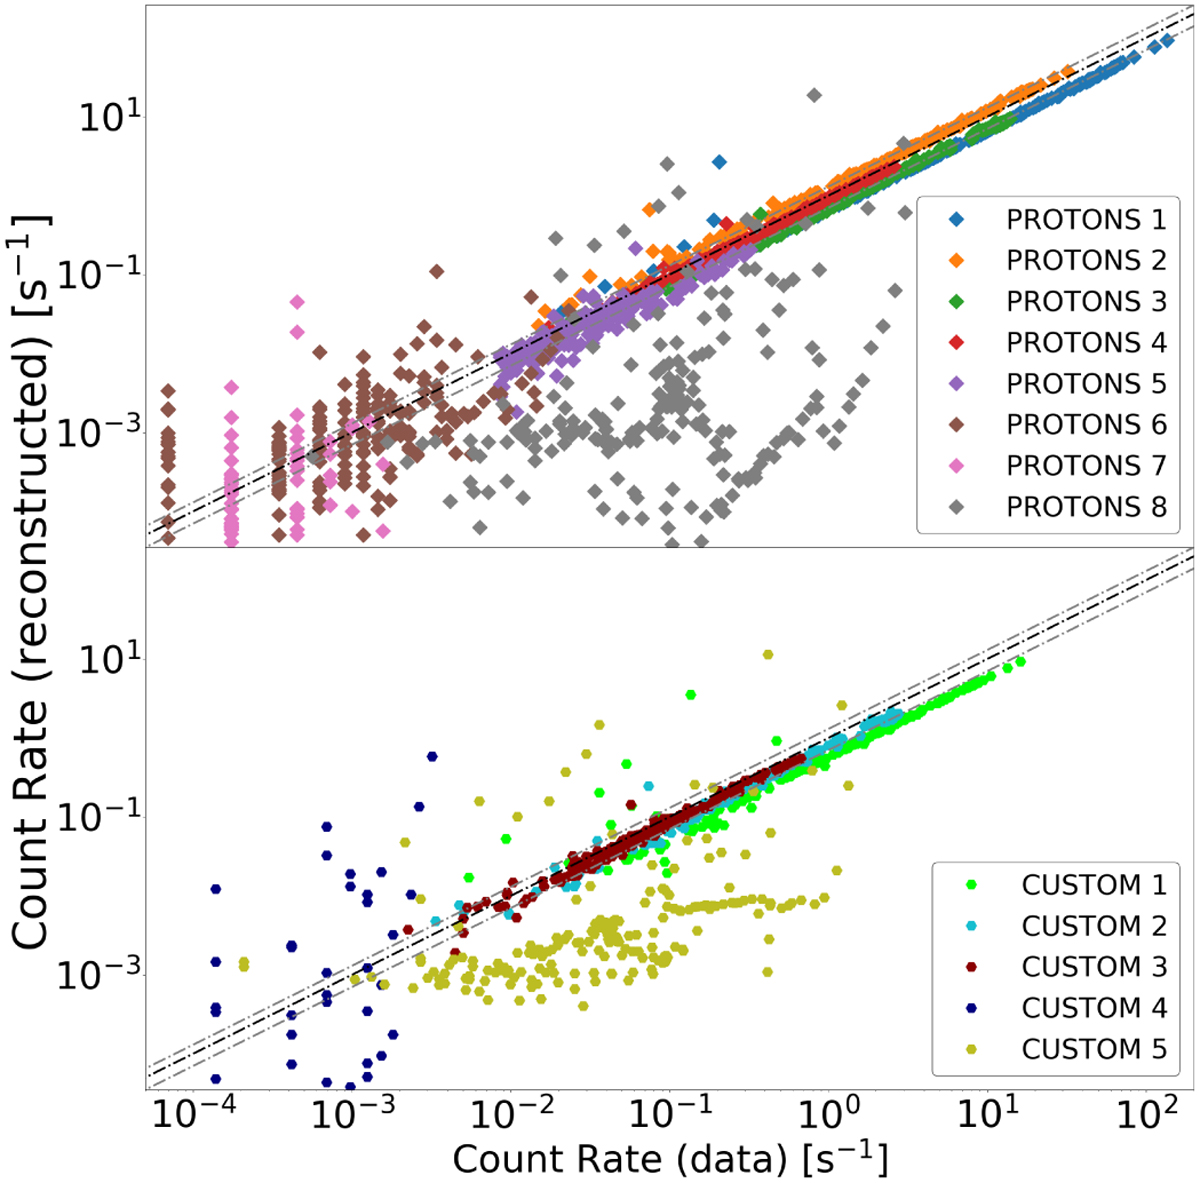
Comparison between the flight rates observed in the PROTONS (top) and CUSTOM (bottom) detection bins and the rates reconstructed using a rolling power law fit for each point in time with at least five detection bins above the background. Each colour represents a different detection bin. The black line represents a perfect reconstruction and the two lines in grey represent a 30% deviation.
Current usage metrics show cumulative count of Article Views (full-text article views including HTML views, PDF and ePub downloads, according to the available data) and Abstracts Views on Vision4Press platform.
Data correspond to usage on the plateform after 2015. The current usage metrics is available 48-96 hours after online publication and is updated daily on week days.
Initial download of the metrics may take a while.