| Issue |
A&A
Volume 708, April 2026
|
|
|---|---|---|
| Article Number | L13 | |
| Number of page(s) | 7 | |
| Section | Letters to the Editor | |
| DOI | https://doi.org/10.1051/0004-6361/202558267 | |
| Published online | 13 April 2026 | |
Letter to the Editor
Detection of CO2 ice in the planetary nebula NGC 6302
1
Department of Physics and Astronomy, University of Western Ontario, London, Ontario, Canada
2
Institute for Earth and Space Exploration, University of Western Ontario, London, Ontario, Canada
3
Leiden Observatory, Leiden University, PO Box 9513, 2300 RA, Leiden, The Netherlands
4
Space Policy Institute, George Washington University, 20052 Washington, DC, USA
5
Cardiff Hub for Astrophysics Research and Technology (CHART), School of Physics and Astronomy, Cardiff University, The Parade, Cardiff CF24 3AA, UK
6
Space Telescope Science Institute, 3700 San Martin Drive, Baltimore, MD 21218, USA
7
Department of Physics and Astronomy, University of North Carolina, Chapel Hill, NC 27599-3255, USA
8
Department of Astronomy, University of Texas at Austin, Austin, TX 78712, USA
9
Department of Physics, Maynooth University, Maynooth, County Kildare, Ireland
10
Laboratório Nacional de Astrofísica, Rua dos Estados Unidos, 154, Bairro das Nações, Itajubá, MG 37504-365, Brazil
11
Department of Physics and Astronomy, University College London, Gower Street, London WC1E 6BT, United Kingdom
12
Chalmers University of Technology, Onsala Space Observatory, 439 92 Onsala, Sweden
13
Institute for Scientific Research, Boston College, 140 Commonwealth Avenue, Chestnut Hill, MA 02467, USA
14
Center for Imaging Science, Rochester Institute of Technology, Rochester, NY 14623, USA
15
School of Physics and Astronomy, Rochester Institute of Technology, Rochester, NY 14623, USA
16
Laboratory for Multiwavelength Astrophysics, Rochester Institute of Technology, Rochester, NY 14623, USA
17
Institut de Ciències de l’Espai (ICE, CSIC), Can Magrans, s/n, E-08193 Cerdanyola del Vallès, Barcelona, Spain
18
ICREA, Pg. Lluís Companys 23, E-08010 Barcelona, Spain
19
Institut d’Estudis Espacials de Catalunya (IEEC), E-08860 Castelldefels, Barcelona, Spain
20
Instituto de Física e Química, Universidade Federal de Itajubá, Av. BPS 1303 Pinheirinho, 37500-903 Itajubá, MG, Brazil
21
Jet Propulsion Laboratory, 4800 Oak Grove Drive, California Institute of Technology, Pasadena, CA 91109, USA
22
University of West Georgia, 1601 Maple Street, Carrollton, GA 30118, USA
23
European Southern Observatory, Karl-Schwarzschild Strasse 2, D-85748 Garching, Germany
24
Department of Astrophysics/IMAPP, Radboud University, PO Box 19 9010, 6500 GL, Nijmegen, The Netherlands
25
SRON Netherlands Institute for Space Research, Niels Bohrweg 4, 2333 CA, Leiden, The Netherlands
26
Jodrell Bank Centre for Astrophysics, Department of Physics and Astronomy, The University of Manchester, Oxford Road, Manchester M13 9PL, UK
★ Corresponding author: This email address is being protected from spambots. You need JavaScript enabled to view it.
Received:
26
November
2025
Accepted:
23
February
2026
Abstract
Using JWST/MIRI observations, we report the detection of CO2 ice in the dusty torus of the planetary nebula NGC 6302, an environment generally considered hostile to fragile molecular species and ices due to intense UV irradiation. This detection accompanies cold (20–50 K) gas-phase CO2 along the same sightlines. The ice absorption profile exhibits a double-peak profile, which is characteristic of pure crystalline CO2 ice. The CO2 gas-to-ice ratio is higher by more than an order of magnitude than in young stellar objects, which indicates distinct ice formation or processing mechanisms in evolved stellar environments. This discovery demonstrates that the dusty torus provides sufficient shielding to harbor ice chemistry, and that ice-mediated surface reactions must be incorporated into chemical models of planetary nebulae.
Key words: astrochemistry / circumstellar matter / ISM: general / ISM: molecules / planetary nebulae: general
© The Authors 2026
 Open Access article, published by EDP Sciences, under the terms of the Creative Commons Attribution License (https://creativecommons.org/licenses/by/4.0), which permits unrestricted use, distribution, and reproduction in any medium, provided the original work is properly cited.
This article is published in open access under the Subscribe to Open model. This email address is being protected from spambots. You need JavaScript enabled to view it. to support open access publication.
1. Introduction
During the asymptotic giant branch (AGB) phase, low- to intermediate-mass (∼1–8 M⊙) stars experience substantial mass loss (∼10−8 to 10−4 M⊙ yr−1; see Höfner & Olofsson 2018), and as this material expands outward and cools, a wide variety of molecules and dust grains form. As the central star evolves through the post-AGB phase and when Teff ≳ 20 000 K, intense UV radiation begins to ionize the circumstellar material, forming a planetary nebula (PN). This is a generally hostile environment where photo-dissociation, photo-evaporation, and energetic stellar outflows dramatically reduce molecular diversity (Agúndez 2022). However, our understanding of the chemical pathways operating in PNe remains incomplete. JWST observations have only just begun to reveal some of these processes. Among observed objects, the Butterfly nebula (NGC 6302; a complex bipolar PN) has emerged as a particularly intriguing laboratory due to its extreme environment and surprisingly rich chemistry.
NGC 6302 is an oxygen-rich (O-rich) evolved object that was never a carbon star (Wright et al. 2011; Matsuura et al. 2025). Recent JWST/MIRI (Mid-Infrared Instrument) observations have revealed the presence of CH3+ (Bhatt et al. 2025b), which is a key driver of organic chemistry (Smith 1992; Herbst 2021; Berné et al. 2023; Zannese et al. 2025; Goicoechea et al. 2025), and whose formation is enabled by the intense UV radiation from the central star. Moreover, the widespread presence of polycyclic aromatic hydrocarbons in this object (Matsuura et al. 2025) is also puzzling, and large variations in its spectral features indicate in situ formation and/or processing (Clark et al., in prep.). These two findings demonstrate that this extreme environment supports rich chemical processes, and NGC 6302 thus represents a particularly intriguing laboratory for investigating some of the complex chemical pathways in PNe. We report another surprising discovery: the clear spectral signatures of cold CO2 gas and the presence of CO2 ice features. This marks the first detection of CO2 ice in a PNe.
2. The torus of NGC 6302
NGC 6302 exhibits bright east-west oriented bipolar lobes bisected by a massive dusty torus (oriented north-south; see Fig. A.1) that appears as a dark lane obscuring the central star at visible and near-infrared (NIR) wavelengths (Kastner et al. 2022). Atacama Large Millimeter Array (ALMA) 12CO J = 3–2 observations reveal that the torus is non-Keplerian and radially expanding at 8 km s−1, with a kinematical age of 5000–7500 years (Peretto et al. 2007; Santander-García et al. 2017). JWST mid-infrared observations show that the torus is flared and warped, extending to a radius of 5.5″ (5700 AU) at infrared wavelengths (Matsuura et al. 2025). The extinction in the torus at 5.9 μm yields Av > 76 mag, indicating a (dust + gas) mass of 0.8–3 M⊙ and a hydrogen density of nH ∼ 6 × 106 cm−3 (Matsuura et al. 2025). Infrared Space Observatory (ISO) spectra of NGC 6302 reveal the presence of crystalline silicates and carbonates (Molster et al. 2001; Kemper et al. 2002b).
This work uses JWST MIRI/MRS (Medium Resolution Spectroscopy) observations (Wells et al. 2015; Argyriou et al. 2023) of NGC 6302 (program ID 1742; PI: M. Matsuura), covering the central star, torus, and innermost region of the bipolar lobes (Fig. A.1). The data reduction was performed using the JWST calibration pipeline version 1.16.1 and CRDS version 11.17.19 (see Matsuura et al. 2025 and Clark et al., in prep., for details of the data reduction).
3. Gas-phase CO2 absorption
The JWST/MIRI MRS spectra toward the northern part of the torus (see Fig. A.1) reveal clear absorption features in the 14.8–15.2 μm range corresponding to the ν2 bending mode of gas-phase CO2 (see Fig. 1). We calculated CO2 model spectra as described in Cami et al. (2010), using the Carbon Dioxide Spectroscopic Database (CDSD) line list for 12CO2 (Tashkun & Perevalov 2010). We adopted a Gaussian intrinsic line profile with a line width b = 1 km s−1 and smoothed and resampled the resulting spectra to match the JWST/MIRI resolution at 15 μm. We used a model grid that spans temperatures of 10–100 K (in 10 K steps), and a logarithmic grid in column densities in the range of log N = 14–19 cm−2 (in steps of log N = 0.1). We also considered radial velocities in the range of −70 to −26 km s−1 (in 1 km s−1 steps). This is a slightly wider velocity range than found by ALMA observations (Santander-García et al. 2017).
 |
Fig. 1. Detection of CO2 ice and gas. The overplotted black curve shows the JWST/MIRI spectrum at the position indicated by the dot in Fig. A.1. The uncertainties on the surface brightness are ∼ ± 40 MJy sr−1. The best-fit gas-phase model (Tgas = 30 K and log N = 16.8 cm−2) is shown in blue. We divided out this model, resulting in the brown curve. The orange curve shows a single-temperature model for clinoenstatite emission. The dashed gray line shows the continuum we adopted to analyze the ice band. The green curve shows the normalized spectrum using that continuum. The red curve shows a laboratory spectrum for CO2 ice (CO:CO2 2:1 ice mixture at 80 K); and the bottom panel shows the residuals between the normalized spectrum (green) and the ice model (red). |
The CO2 absorption occurs against a structured continuum. To determine this local continuum, we masked the narrow CO2 absorption features and fit a polynomial to the spectra. We then used this continuum to normalize the observed spectrum (see Fig. B.1) and performed a least-squares minimization at each pixel to simultaneously determine the excitation temperature, column density, and radial velocity of the gas-phase CO2. We determined the 1σ uncertainties on these best-fit parameters from the χ2 hypersurface. The local thermodynamic equilibrium CO2 slab models generally reproduce the absorption very well (see Fig. 1). The CO2 gas is cold everywhere we detect it, with temperatures in a narrow range of 20–50 K (with typical uncertainties of ±10 K; Fig. A.2) for the majority of the spaxels. The column densities of this cold CO2 gas increase smoothly by over an order of magnitude from the outer edge (log N = 15.2 ± 0.1 cm−2) to the torus midplane (log N = 16.8 ± 0.1 cm−2; Fig. A.1). For most pixels, the derived radial velocities, in the barycentric reference frame, range from −55 to −30 km s−1 (with typical uncertainties of ±3 km s−1), similar to the range (–40 to –30 km s−1) found using ALMA 12CO J = 3–2 observations (Santander-García et al. 2017). We also detect much weaker spectral features of gas-phase 13CO2 (see Appendix B).
4. Detection of CO2 ice
The cold gas-phase CO2 is located in the dusty torus of NGC 6302; this coexistence of dust and cold CO2 gas mirrors the conditions in envelopes of young stellar objects (YSOs) where CO2 forms on cold dust grains, produces ice mantles, and desorbs when the temperature rises above the sublimation threshold. CO2 ice formation thus appears plausible in NGC 6302 as well, and we therefore searched for the characteristic ν2 bending mode at ∼15.2 μm in the MIRI data.
To isolate potential ice absorption, we first divided the observations by the best-fit CO2 gas model (see Fig. 1). The resulting spectrum (brown curve in Fig. 1) reveals a structured continuum containing spectral features from crystalline silicates (Molster et al. 2001; Kemper et al. 2002b,a). This complexity introduces significant uncertainty in the continuum placement. Comparison with laboratory spectra shows that clinoenstatite in particular bears similarities to the spectrum (see Fig. C.1) and produces a strong absorption band at ∼15.4 μm that overlaps with the expected CO2 ice band (Fig. 1). Despite this contamination, we identified two key signatures of CO2 ice: (1) a shallow, broad absorption between ∼14.9–15.15 μm, and (2) a second absorption between ∼15.2–15.3 μm. This characteristic double-peak structure matches laboratory CO2 ice spectra and is clearly distinct from the single, deeper clinoenstatite band at 15.4 μm or its weaker features. We fit a local continuum (gray curve in Fig. 1) to bracket these CO2 features while avoiding regions dominated by silicate absorption. Given the dust complexity and continuum uncertainties, we cannot perform a detailed ice mixture decomposition. However, the distinctive double-peak signature provides a robust identification of CO2 ice despite the challenging spectral environment.
To improve the signal-to-noise ratio, we co-added spectra from all spaxels containing gas-phase CO2 (resulting in the grey curve in Fig. 2a). The co-added spectrum reveals residual fringes that are not fully corrected by the MIRI data reduction pipeline. We applied a Savitzky-Golay filter (Savitzky & Golay 1964; Luo et al. 2005) to smooth out these fringes (black curve in Fig. 2a). The resulting co-added spectrum reveals a clear double-peaked feature where the ∼15.05 μm feature is further split into two components and shows a broad blue wing.
 |
Fig. 2. Comparison of observational and laboratory ice spectra. (a) Co-added CO2 absorption profile across all pixels with detectable CO2 (gray), with the smoothed profile after masking the H I line at 14.96 μm overplotted in black. Laboratory spectra: (b) CO:CO2 (2:1) at 80 K (green); (c) H2O:CH3OH:CO2 (0.8:0.9:1) at 125 K (blue); (d) pure CO2 at 25 K (brown); (e) pure CO2 on amorphous silicate spheres at 15 K (red); (f) H2O:CO2 (1:6) at 75 K (pink). |
Analysis of CO2 ice absorption profiles in YSOs typically involves fitting a linear combination of five unique components to the data, each attributed to CO2 in a different chemical environment (Pontoppidan et al. 2008; Brunken et al. 2024, 2025; Potapov et al. 2025). However, this approach is not suitable for our data. The S/N of individual spaxels is too low for a reliable component decomposition, while the co-added spectrum represents a spatial average over disparate sightlines with varying physical conditions, making the interpretation of fitted components ambiguous. Given the continuum uncertainties described above and possible contamination from dust features, we instead relied on a direct comparison with laboratory spectra to identify the presence of CO2 ice.
We compared the observed 15.2 μm absorption profile with laboratory spectra from the Leiden Ice Database for Astrochemistry1, including pure CO2 ice and mixtures with CO, H2O, CH3OH, and other species at various temperatures. The observed double-peak structure best resembles CO:CO2 (2:1) at 80 K and H2O:CH3OH:CO2 (0.8:0.9:1) at 120 K (Fig. 2 Ehrenfreund et al. 1999; van Broekhuizen et al. 2006), reproducing the characteristic peak positions and relative intensities. The spectra of pure CO2 ice and H2O:CO2 mixture also show a double-peak feature, but lack a broad blue wing (at ∼15.15 μm). A model of pure CO2-ice coated amorphous silicate spheres (Poteet et al. 2013) better resembles our profile with its triple-peak structure and broad blue wing. While Poteet et al. (2013) presented a model at only 15 K, their tabulated peak positions show a decreasing peak separation with increasing temperature, suggesting that higher-temperature models would match our observations better. Because the exact profile is sensitive to the grain shape, size distribution, and ice composition, we cannot reliably determine the specific ice mixture or temperature from our data, but the 15.2 μm feature confirms the presence of CO2 ice in the torus of NGC 6302.
We calculated the average column density of CO2 ice from the co-added and smoothed spectrum as 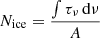 , where ∫τνdν is the integrated optical depth, and A is the band strength. We used a value of A = 1.6 × 10⁻¹⁷ cm molecule−1 (Bouilloud et al. 2015) and derived Nice ≈ (1 ± 0.3)×1016 cm−2. The uncertainty here accounts for the observational error.
5. Discussion
Molecular ices (e.g., H2O, CO, CO2, and CH4) are abundant in cold, shielded environments, including dense molecular clouds, envelopes of YSOs, and protoplanetary disks (Boogert et al. 2015; Cuppen et al. 2024). The conditions required for the formation of H2O ice are also met in dense AGB and post-AGB outflows, as suggested by observations (Smith et al. 1988; Omont et al. 1990; Sylvester et al. 1999; Hoogzaad et al. 2002; Sahai et al. 2003; Manteiga et al. 2011). However, PNe present much harsher conditions due to the intense UV fields from the central star, making ice formation or survival generally infeasible (Dijkstra et al. 2006). Only three PNe show H2O ice: CPD-56°8032 (Cohen et al. 1999), NGC 6537 (Molster et al. 2002), and NGC 6302 (Molster et al. 2001), and they are all characterized by massive dusty tori that provide exceptional shielding.
Our detection of CO2 ice in NGC 6302 represents the first identification of an ice species more volatile than H2O in any PN. Ice-mantle formation depends on the balance between condensation and desorption, which varies with the binding energy of involved species, grain surface composition, and local physical conditions. For example, H2O (the most abundant astrophysical ice) has the highest binding energy and can typically remain in solid state at temperatures up to 150 K. On the other hand, CO2 and CO have lower binding energies and thus desorb (in pure form) at 70–90 K and 20–30 K, respectively (Minissale et al. 2022). The detection of CO2 ice therefore indicates both sufficient shielding and relatively cold temperatures in NGC 6302’s torus.
The high spatial resolution of JWST revealed that extinction toward the NGC 6302 torus (AV > 76 mag; Matsuura et al. 2025) is higher by an order of magnitude than previously inferred from optical/NIR observations (AV ≈ 6 − 8 mag; Matsuura et al. 2005; Wright et al. 2011). This extreme shielding protects the ice from the central star’s intense UV field (Teff ≈ 220 000 K), allowing CO2 ice to survive. While NGC 6302 may represent an extreme case, dense dusty tori are common around evolved stars, particularly in binary systems (Izzard & Jermyn 2023, and references therein), suggesting that molecular ices may be more prevalent in these environments than previously recognized. JWST/MIRI’s spatially resolved spectroscopy can now identify such highly shielded regions and assess the prevalence of ices in other PNe.
The observed CO2 ice profile exhibits a double-peak structure, which is characteristic of pure crystalline CO2 ice, suggesting that CO2 is present either in the pure form or in a mixture that is thermally processed (see Fig. 2; Ehrenfreund et al. 1997a, 1998; van Broekhuizen et al. 2006; Poteet et al. 2013). The CO2 gas-to-ice ratio (Ngas/Nice) in NGC 6302 is ∼1, much higher than in YSOs (∼0.02–0.15; An et al. 2009, 2011), indicating a fundamentally different formation pathway in PNe environments. CO2 might have formed primarily in the gas phase during the AGB or post-AGB phase. (see, e.g., Justtanont et al. 1998; Cami et al. 2000; Malek & Cami 2014) with subsequent freeze-out onto grains. While models of AGB outflows have successfully reproduced observed H2O ice column densities by incorporating accretion of gas-phase H2O by gas-grain collisions (Dijkstra et al. 2003; Van de Sande et al. 2019), extending these models to include freeze-out of CO2 in PN environments represents an important avenue for future work.
The presence of CO2 ice in the PNe environment has important implications for the interstellar medium (ISM) enrichment. CO2 ice facilitates the surface chemistry required for the formation of complex organic molecules such as formic acid (HCOOH), glycolaldehyde (CH2OHCHO), and acetaldehyde (CH3CHO; Herbst & van Dishoeck 2009; Jin & Garrod 2020; Potapov & McCoustra 2021; Garrod et al. 2022). Once formed, UV processing of these ices can drive further chemical complexity and controlled release back to the gas-phase, suggesting that PNe might contribute to the interstellar reservoir of organic material. If these species survive the prevailing physical and chemical processing, they may ultimately be incorporated into new star-forming systems. This chemistry must be included in current PN chemical models and ISM enrichment models.
To comprehend the full picture, characterizing the full ice inventory in NGC 6302 is critical. The most abundant ice species in astrophysical environments, H2O, CO2, CO, CH3OH, and NH3, have strong NIR absorption bands that are accessible to JWST NIRSpec, which can also detect their gas-phase counterparts to provide complementary information on sublimation processes and the ice-gas balance. Observations with a high spatial resolution would constrain the chemical pathways, temperature structure, and ice-processing mechanisms and establish whether the ice chemistry is common in dense PN tori.
6. Conclusions
We reported the detection of CO2 ice in a PN through spatially resolved JWST/MIRI observations of NGC 6302. This discovery demonstrates that molecular ices can form and survive in the heavily shielded regions of massive circumstellar tori, challenging the prevailing view that PNe are hostile to ice chemistry. We found cold CO2 gas along the same lines of sight as CO2 ice. The gas-to-ice ratio differs markedly from that observed in YSOs, which indicates distinct ice formation or processing mechanisms in evolved stellar environments. Characterizing the full ice composition (H2O, CO, CH3OH, and NH3) and spatial distribution through JWST NIRSpec observations will be essential for understanding the chemical complexity of these systems. This shows that PNe are a frontier for ice chemistry. Ice surface chemistry, which is crucial for the formation of complex organic molecules, operates in these environments, and other massive dusty tori may harbor similar chemistry. Chemical models must incorporate ice-mediated pathways.
Acknowledgments
This work is based on observations made with the NASA/ESA/CSA James Webb Space Telescope. All of the data presented in this article were obtained from the Mikulski Archive for Space Telescopes (MAST) at the Space Telescope Science Institute. The data of this specific observing program can be accessed via doi:10.17909/s1rn-1t84. This study is based on the international consortium of ESSENcE (Evolved Stars and their Nebulae in the JWST era). This article/publication is based upon work from COST Action NanoSpace, CA21126, supported by COST (European Cooperation in Science and Technology). C.B., S.C., J.C., E.P. and N.C. acknowledge support from the University of Western Ontario, the Canadian Space Agency (CSA) [22JWGO1-22], and the Natural Sciences and Engineering Research Council of Canada. K.E.K. acknowledges support from grant JWST-GO-01742.010-A and H.L.D. from JWST-GO-01742.004 A. FK acknowledges support from the Spanish Ministry of Science, Innovation and Universities, under grant number PID2023-149918NB-I00. This work was also partly supported by the Spanish program Unidad de Excelencia María de Maeztu CEX2020-001058-M, financed by MCIN/AEI/10.13039/501100011033. RS’s contribution to the research described here was carried out at the Jet Propulsion Laboratory, California Institute of Technology, under a contract with NASA (80NM0018D0004), and partially funded by award JWST-GO-01742.005-A from the STScI under NASA contract NAS5-03127.
References
- Agúndez, M. 2022, EPJ Web Conf., 265, 00029 [Google Scholar]
- An, D., Ramírez, S. V., Sellgren, K., et al. 2009, ApJ, 702, L128 [Google Scholar]
- An, D., Ramírez, S. V., Sellgren, K., et al. 2011, ApJ, 736, 133 [Google Scholar]
- Argyriou, I., Glasse, A., Law, D. R., et al. 2023, A&A, 675, A111 [NASA ADS] [CrossRef] [EDP Sciences] [Google Scholar]
- Berné, O., Martin-Drumel, M.-A., Schroetter, I., et al. 2023, Nature, 621, 56 [CrossRef] [Google Scholar]
- Bhatt, C., Cami, J., Peeters, E., et al. 2025b, ApJ, 995, 67 [Google Scholar]
- Boogert, A. C. A., Gerakines, P. A., & Whittet, D. C. B. 2015, ARA&A, 53, 541 [Google Scholar]
- Bouilloud, M., Fray, N., Bénilan, Y., et al. 2015, MNRAS, 451, 2145 [Google Scholar]
- Brunken, N. G. C., van Dishoeck, E. F., Slavicinska, K., et al. 2024, A&A, 692, A163 [NASA ADS] [CrossRef] [EDP Sciences] [Google Scholar]
- Brunken, N. G. C., Boogert, A. C. A., van Dishoeck, E. F., et al. 2025, ACS Earth Space Chem., 9, 1992 [Google Scholar]
- Cami, J., Yamamura, I., de Jong, T., et al. 2000, A&A, 360, 562 [Google Scholar]
- Cami, J., van Malderen, R., & Markwick, A. J. 2010, ApJS, 187, 409 [Google Scholar]
- Cohen, M., Barlow, M. J., Sylvester, R. J., et al. 1999, ApJ, 513, L135 [NASA ADS] [CrossRef] [Google Scholar]
- Cuppen, H. M., Linnartz, H., & Ioppolo, S. 2024, ARA&A, 62, 243 [Google Scholar]
- Dijkstra, C., Dominik, C., Hoogzaad, S. N., de Koter, A., & Min, M. 2003, A&A, 401, 599 [NASA ADS] [CrossRef] [EDP Sciences] [Google Scholar]
- Dijkstra, C., Dominik, C., Bouwman, J., & de Koter, A. 2006, A&A, 449, 1101 [NASA ADS] [CrossRef] [EDP Sciences] [Google Scholar]
- Ehrenfreund, P., Boogert, A. C. A., Gerakines, P. A., Tielens, A. G. G. M., & van Dishoeck, E. F. 1997a, A&A, 328, 649 [NASA ADS] [Google Scholar]
- Ehrenfreund, P., Dartois, E., Demyk, K., & D’Hendecourt, L. 1998, A&A, 339, L17 [NASA ADS] [Google Scholar]
- Ehrenfreund, P., Kerkhof, O., Schutte, W. A., et al. 1999, A&A, 350, 240 [NASA ADS] [Google Scholar]
- Garrod, R. T., Jin, M., Matis, K. A., et al. 2022, ApJS, 259, 1 [NASA ADS] [CrossRef] [Google Scholar]
- Goicoechea, J. R., Pety, J., Cuadrado, S., et al. 2025, A&A, 696, A100 [NASA ADS] [CrossRef] [EDP Sciences] [Google Scholar]
- Herbst, E. 2021, Front. Astron. Space Sci., 8, 207 [NASA ADS] [CrossRef] [Google Scholar]
- Herbst, E., & van Dishoeck, E. F. 2009, ARA&A, 47, 427 [NASA ADS] [CrossRef] [Google Scholar]
- Höfner, S., & Olofsson, H. 2018, A&ARv, 26, 1 [Google Scholar]
- Hoogzaad, S. N., Molster, F. J., Dominik, C., et al. 2002, A&A, 389, 547 [NASA ADS] [CrossRef] [EDP Sciences] [Google Scholar]
- Izzard, R. G., & Jermyn, A. S. 2023, MNRAS, 521, 35 [NASA ADS] [CrossRef] [Google Scholar]
- Jin, M., & Garrod, R. T. 2020, ApJS, 249, 26 [Google Scholar]
- Justtanont, K., Feuchtgruber, H., de Jong, T., et al. 1998, A&A, 330, L17 [NASA ADS] [Google Scholar]
- Kastner, J. H., Moraga Baez, P., Balick, B., et al. 2022, ApJ, 927, 100 [NASA ADS] [CrossRef] [Google Scholar]
- Kemper, F., Jäger, C., Waters, L. B. F. M., et al. 2002a, Nature, 415, 295 [Google Scholar]
- Kemper, F., Molster, F. J., Jäger, C., & Waters, L. B. F. M. 2002b, A&A, 394, 679 [NASA ADS] [CrossRef] [EDP Sciences] [Google Scholar]
- Luo, J., Ying, K., & Bai, J. 2005, Signal Process., 85, 1429 [Google Scholar]
- Malek, S. E., & Cami, J. 2014, ApJ, 780, 41 [Google Scholar]
- Manteiga, M., García-Hernández, D. A., Ulla, A., Manchado, A., & García-Lario, P. 2011, AJ, 141, 80 [NASA ADS] [CrossRef] [Google Scholar]
- Matsuura, M., Zijlstra, A. A., Molster, F. J., et al. 2005, MNRAS, 359, 383 [Google Scholar]
- Matsuura, M., Volk, K., Kavanagh, P., et al. 2025, MNRAS, 542, 1287 [Google Scholar]
- Minissale, M., Aikawa, Y., Bergin, E., et al. 2022, ACS Earth Space Chem., 6, 597 [NASA ADS] [CrossRef] [Google Scholar]
- Molster, F. J., Lim, T. L., Sylvester, R. J., et al. 2001, A&A, 372, 165 [NASA ADS] [CrossRef] [EDP Sciences] [Google Scholar]
- Molster, F. J., Waters, L. B. F. M., Tielens, A. G. G. M., & Barlow, M. J. 2002, A&A, 382, 184 [NASA ADS] [CrossRef] [EDP Sciences] [Google Scholar]
- Moraga Baez, P., Kastner, J. H., Bublitz, J., et al. 2026, ApJ, 998, 7 [Google Scholar]
- Omont, A., Moseley, S. H., Forveille, T., et al. 1990, ApJ, 355, L27 [Google Scholar]
- Peretto, N., Fuller, G., Zijlstra, A., & Patel, N. 2007, A&A, 473, 207 [NASA ADS] [CrossRef] [EDP Sciences] [Google Scholar]
- Pontoppidan, K. M., Boogert, A. C. A., Fraser, H. J., et al. 2008, ApJ, 678, 1005 [NASA ADS] [CrossRef] [Google Scholar]
- Potapov, A., & McCoustra, M. 2021, Int. Rev. Phys. Chem., 40, 299 [CrossRef] [Google Scholar]
- Potapov, A., Linz, H., Bouwman, J., et al. 2025, A&A, 697, A53 [NASA ADS] [CrossRef] [EDP Sciences] [Google Scholar]
- Poteet, C. A., Pontoppidan, K. M., Megeath, S. T., et al. 2013, ApJ, 766, 117 [NASA ADS] [CrossRef] [Google Scholar]
- Sahai, R., Zijlstra, A., Sánchez Contreras, C., & Morris, M. 2003, ApJ, 586, L81 [Google Scholar]
- Santander-García, M., Bujarrabal, V., Alcolea, J., et al. 2017, A&A, 597, A27 [NASA ADS] [CrossRef] [EDP Sciences] [Google Scholar]
- Savitzky, A., & Golay, M. J. E. 1964, Anal. Chem., 36, 1627 [Google Scholar]
- Smith, D. 1992, Chem. Rev., 92, 1473 [Google Scholar]
- Smith, R. G., Sellgren, K., & Tokunaga, A. T. 1988, ApJ, 334, 209 [NASA ADS] [CrossRef] [Google Scholar]
- Sylvester, R. J., Kemper, F., Barlow, M. J., et al. 1999, A&A, 352, 587 [NASA ADS] [Google Scholar]
- Tashkun, S. A., & Perevalov, V. I. 2010, https://doi.org/10.5281/zenodo.18013 [Google Scholar]
- van Broekhuizen, F. A., Groot, I. M. N., Fraser, H. J., van Dishoeck, E. F., & Schlemmer, S. 2006, A&A, 451, 723 [NASA ADS] [CrossRef] [EDP Sciences] [Google Scholar]
- Van de Sande, M., Walsh, C., Mangan, T. P., & Decin, L. 2019, MNRAS, 490, 2023 [Google Scholar]
- Wells, M., Pel, J. W., Glasse, A., et al. 2015, PASP, 127, 646 [NASA ADS] [CrossRef] [Google Scholar]
- Wright, N. J., Barlow, M. J., Ercolano, B., & Rauch, T. 2011, MNRAS, 418, 370 [Google Scholar]
- Zannese, M., Tabone, B., Habart, E., et al. 2025, A&A, 696, A99 [NASA ADS] [CrossRef] [EDP Sciences] [Google Scholar]
Appendix A: Column density and excitation temperature of gas-phase CO2
Figures A.1 and A.2 show the spatial variations in column density and excitation temperature of gas-phase CO2. For details, see Sect. 3.
 |
Fig. A.1. Location of CO2 ice in NGC 6302. The image shows HST/WFC3 observations featuring filter F656N (Kastner et al. 2022), which traces Hα emission. The JWST MIRI mosaic is indicated by the white frame. Contours show the column density of gas-phase CO2, with corresponding log N values (cm−2) provided in the lower left. The yellow dot marks the pixel position (R.A. = 17h:13m:44.402s, Dec. = -37°:06′:10.23 (J2000)) used to extract the spectra shown in Figs. 1, 2, B.1, and C.1. |
 |
Fig. A.2. Spatial distribution of excitation temperature of CO2 gas. The derived best-fit temperature of gas-phase CO2 is mapped on the ALMA 12CO J = 2–1 map (Moraga Baez et al. 2026). The temperature map reveals two blobs of colder CO2 gas, which might indicate clumps in the torus, but needs further investigation. |
Appendix B: Fitting 12CO2 and 13CO2
Along the same sightlines as 12CO2, we detect much weaker spectral features due to gas-phase 13CO2, which has a Q-branch at 15.42 μm. We used the same fitting procedure as described in Sect. 3 to determine the column density of 13CO2, with excitation temperatures and radial velocities tied to the 12CO2 values for each pixel. An example fit is shown in Fig. B.1. From these column densities, we derived 12CO2/13CO2 (and thus 12C/13C) ratios in the range of 4–25, very similar to the range (4–15) reported by Moraga Baez et al. (2026) for NGC 6302 using ALMA observations for 12CO/13CO, H12CO+/H13CO+, and H12CN/H13CN.
 |
Fig. B.1. Representative fit of 12CO2 and 13CO2. The normalized observed spectrum toward the northern part of the torus facing us (R.A. = 17h:13m:44.402s, Dec. = -37°:06′:10.23″ (J2000)) is shown in black, and the best-fit 12CO2 model and 13CO2 model are shown in blue and red, respectively. |
Appendix C: Clinoenstatite absorption
Figure C.1 compares the observed spectrum with the modelled spectrum of clinoenstatite. While this represents a simplified approximation of the dust continuum (which depends of many factors), clinoenstatite clearly cannot reproduce the absorption feature underlying the gas-phase CO2 line at around 15.2μm (see Sect. 4).
 |
Fig. C.1. Comparison of observed spectrum with clinoenstatite model. The black curve represents the observed spectrum toward the same region as used to extract the spectrum in Fig. 1. The orange curve shows the modelled spectrum of clinoenstatite, derived using its optical depth profile under the assumption of blackbody emission for both the background continuum and mineral component. |
All Figures
|
Fig. 1. Detection of CO2 ice and gas. The overplotted black curve shows the JWST/MIRI spectrum at the position indicated by the dot in Fig. A.1. The uncertainties on the surface brightness are ∼ ± 40 MJy sr−1. The best-fit gas-phase model (Tgas = 30 K and log N = 16.8 cm−2) is shown in blue. We divided out this model, resulting in the brown curve. The orange curve shows a single-temperature model for clinoenstatite emission. The dashed gray line shows the continuum we adopted to analyze the ice band. The green curve shows the normalized spectrum using that continuum. The red curve shows a laboratory spectrum for CO2 ice (CO:CO2 2:1 ice mixture at 80 K); and the bottom panel shows the residuals between the normalized spectrum (green) and the ice model (red). |
| In the text | |
|
Fig. 2. Comparison of observational and laboratory ice spectra. (a) Co-added CO2 absorption profile across all pixels with detectable CO2 (gray), with the smoothed profile after masking the H I line at 14.96 μm overplotted in black. Laboratory spectra: (b) CO:CO2 (2:1) at 80 K (green); (c) H2O:CH3OH:CO2 (0.8:0.9:1) at 125 K (blue); (d) pure CO2 at 25 K (brown); (e) pure CO2 on amorphous silicate spheres at 15 K (red); (f) H2O:CO2 (1:6) at 75 K (pink). |
| In the text | |
|
Fig. A.1. Location of CO2 ice in NGC 6302. The image shows HST/WFC3 observations featuring filter F656N (Kastner et al. 2022), which traces Hα emission. The JWST MIRI mosaic is indicated by the white frame. Contours show the column density of gas-phase CO2, with corresponding log N values (cm−2) provided in the lower left. The yellow dot marks the pixel position (R.A. = 17h:13m:44.402s, Dec. = -37°:06′:10.23 (J2000)) used to extract the spectra shown in Figs. 1, 2, B.1, and C.1. |
| In the text | |
|
Fig. A.2. Spatial distribution of excitation temperature of CO2 gas. The derived best-fit temperature of gas-phase CO2 is mapped on the ALMA 12CO J = 2–1 map (Moraga Baez et al. 2026). The temperature map reveals two blobs of colder CO2 gas, which might indicate clumps in the torus, but needs further investigation. |
| In the text | |
|
Fig. B.1. Representative fit of 12CO2 and 13CO2. The normalized observed spectrum toward the northern part of the torus facing us (R.A. = 17h:13m:44.402s, Dec. = -37°:06′:10.23″ (J2000)) is shown in black, and the best-fit 12CO2 model and 13CO2 model are shown in blue and red, respectively. |
| In the text | |
|
Fig. C.1. Comparison of observed spectrum with clinoenstatite model. The black curve represents the observed spectrum toward the same region as used to extract the spectrum in Fig. 1. The orange curve shows the modelled spectrum of clinoenstatite, derived using its optical depth profile under the assumption of blackbody emission for both the background continuum and mineral component. |
| In the text | |
Current usage metrics show cumulative count of Article Views (full-text article views including HTML views, PDF and ePub downloads, according to the available data) and Abstracts Views on Vision4Press platform.
Data correspond to usage on the plateform after 2015. The current usage metrics is available 48-96 hours after online publication and is updated daily on week days.
Initial download of the metrics may take a while.