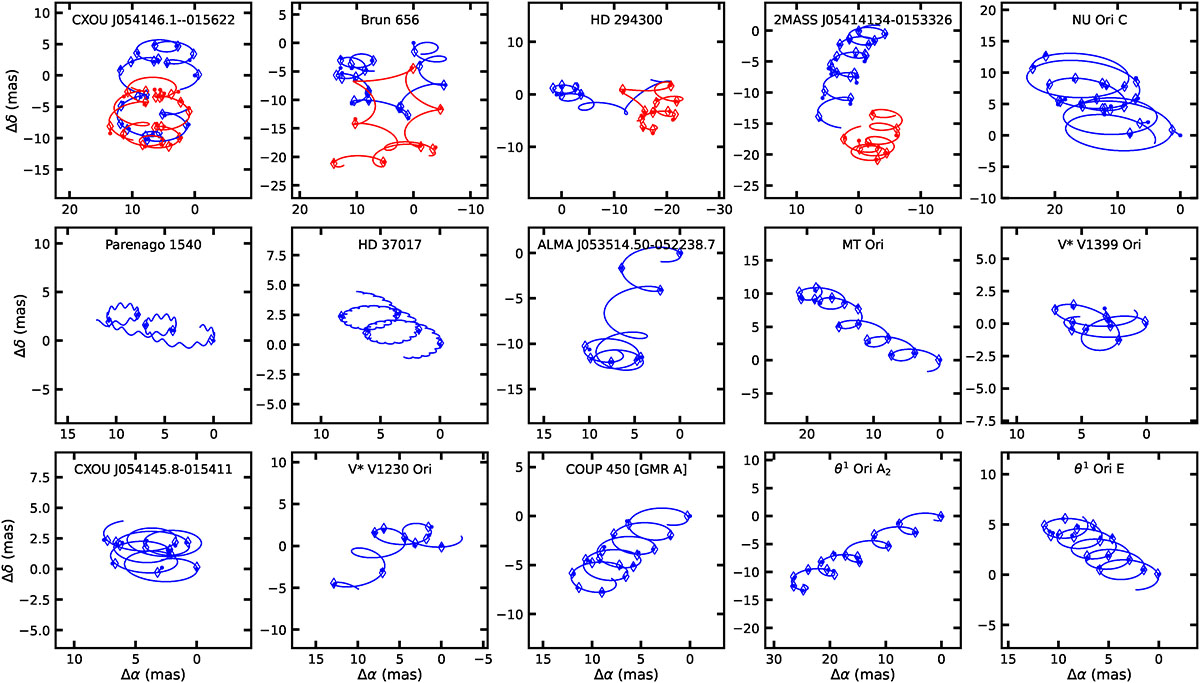
Fig. 2.
Download original image
Best-fit astrometric motions of the radio sources associated with stellar multiple systems. Filled circles mark the measured positions relative to the first detection, solid lines show the best-fit trajectories, and open diamonds indicate the expected positions from the fitted model at the corresponding epochs. Different colors represent the individual stellar components detected within each system.
Current usage metrics show cumulative count of Article Views (full-text article views including HTML views, PDF and ePub downloads, according to the available data) and Abstracts Views on Vision4Press platform.
Data correspond to usage on the plateform after 2015. The current usage metrics is available 48-96 hours after online publication and is updated daily on week days.
Initial download of the metrics may take a while.