Fig. 3
Download original image
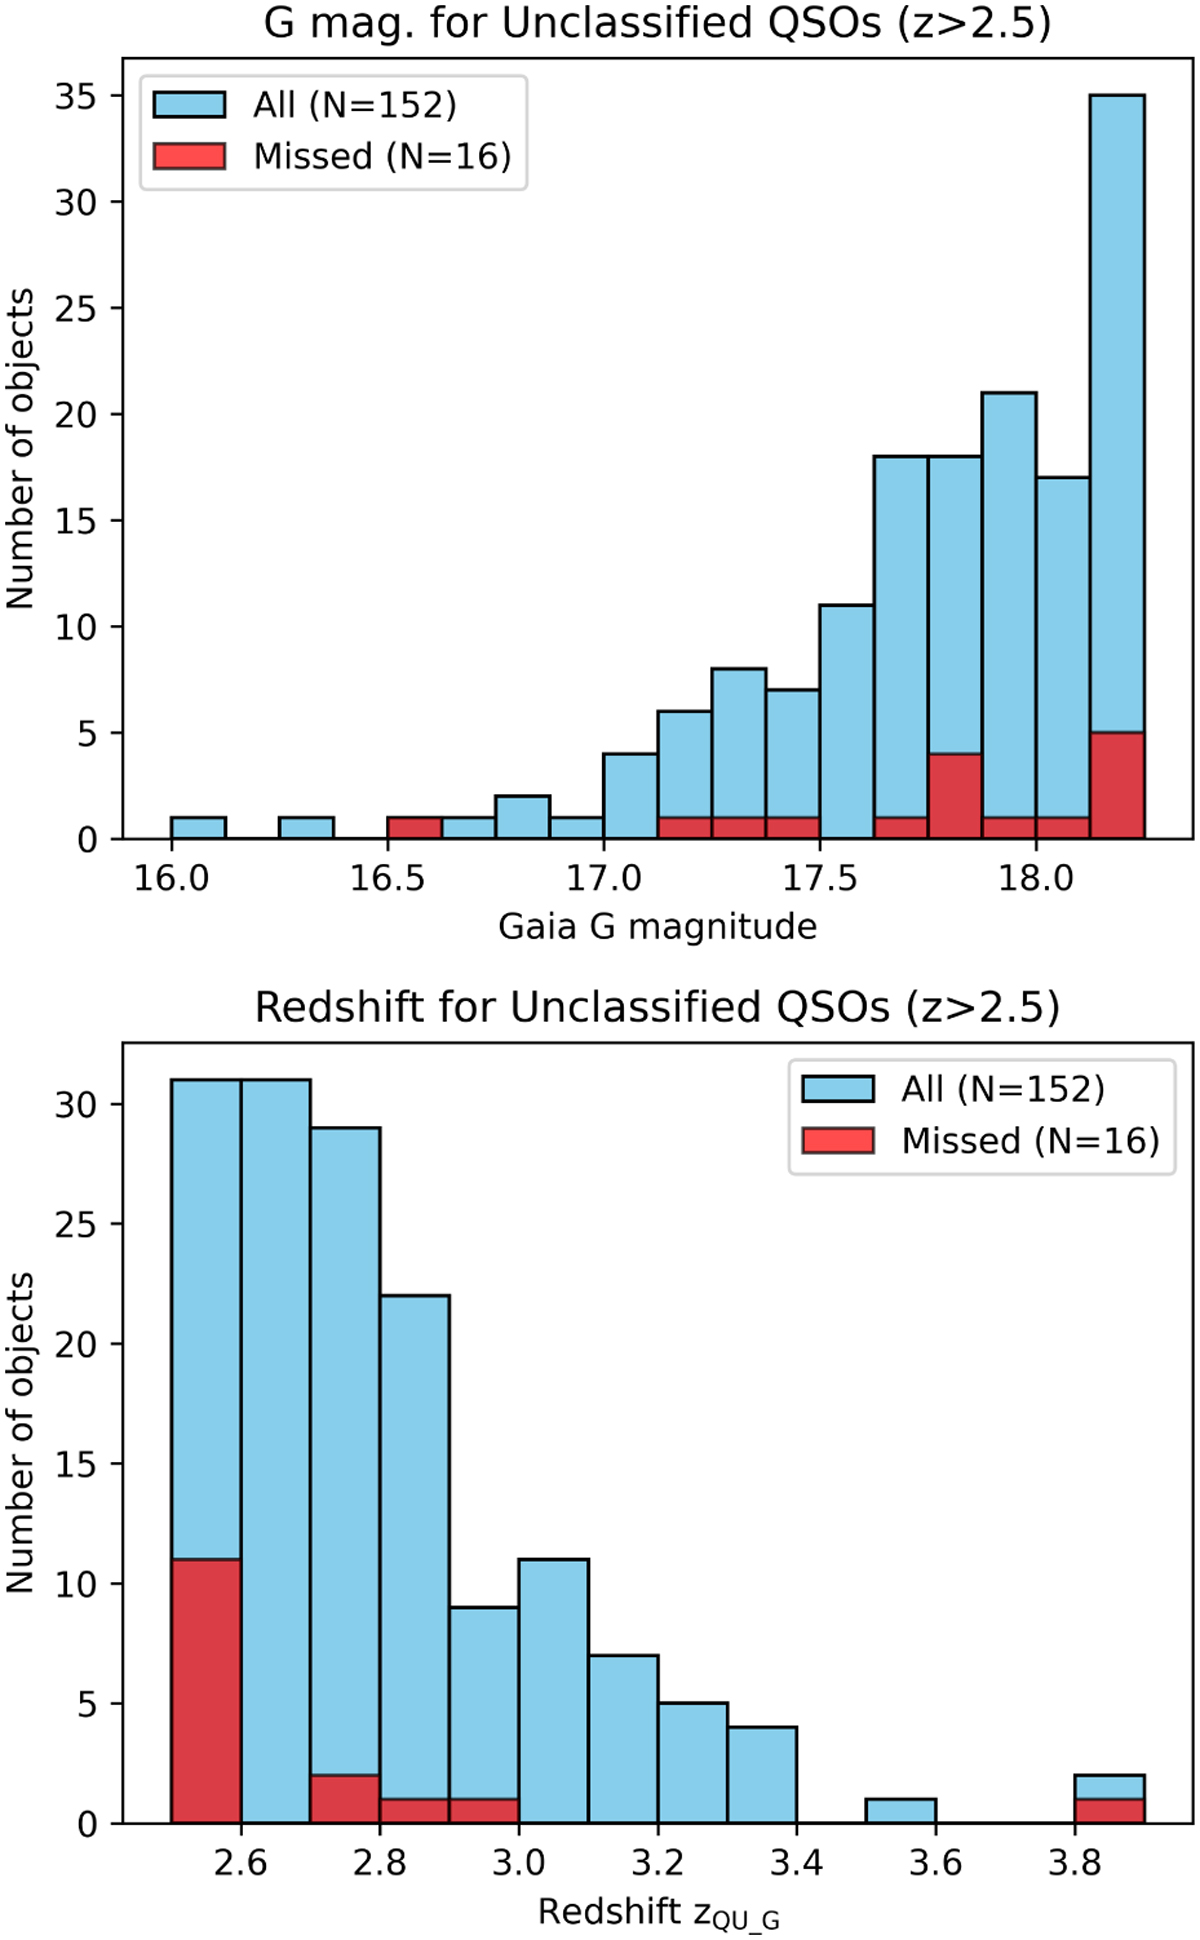
Top : histogram of the Gaia G magnitude for the 152 QSOs with no classification in the XGB sample, with the 16 QSOs that were not identified as candidates (“missed”) highlighted in red. Bottom : histogram of the zQU_G redshifts for the 152 QSOs with no classification in the XGB sample, with the 16 QSOs that were not identified as candidates (“missed”) highlighted in red.
Current usage metrics show cumulative count of Article Views (full-text article views including HTML views, PDF and ePub downloads, according to the available data) and Abstracts Views on Vision4Press platform.
Data correspond to usage on the plateform after 2015. The current usage metrics is available 48-96 hours after online publication and is updated daily on week days.
Initial download of the metrics may take a while.