Fig. 9
Download original image
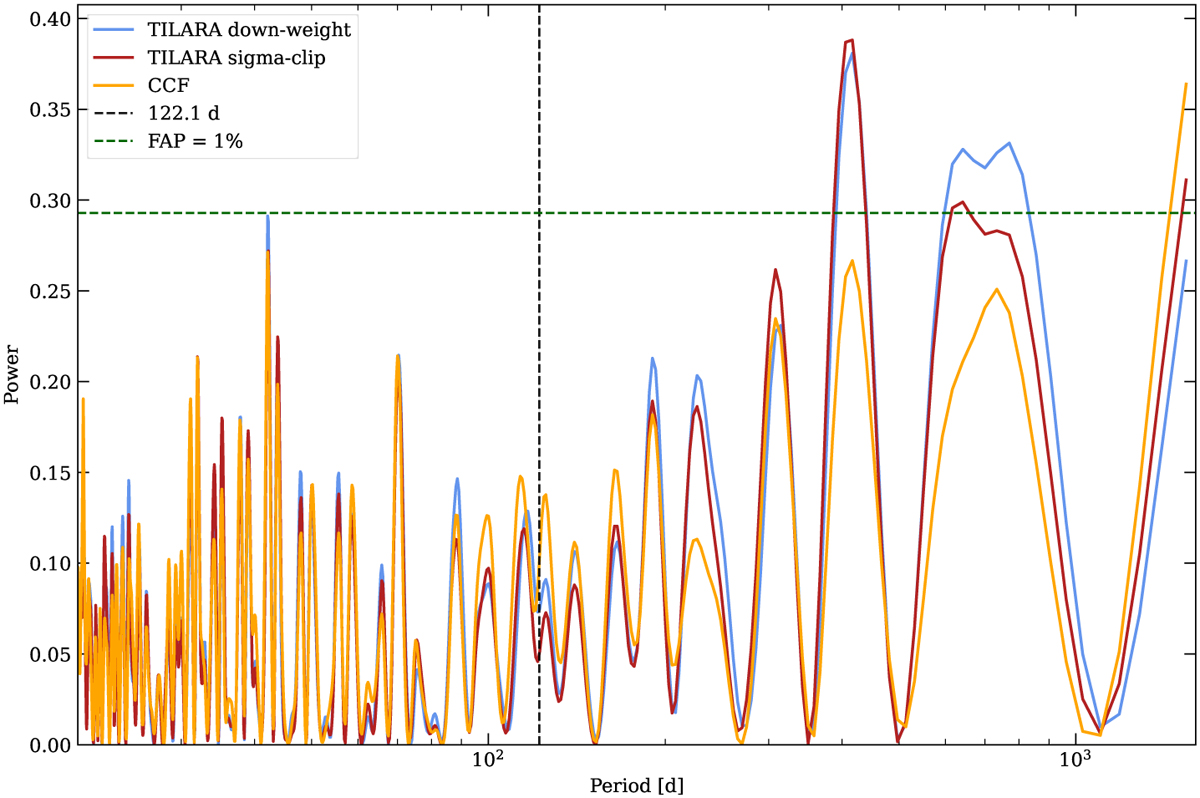
Generalized Lomb–Scargle periodograms of HD 102365 RVs. The orange curve corresponds to CCF-derived RVs, the blue curve shows RVs obtained with TILARA using down-weighting, and the red curve shows RVs obtained with TILARA using sigma-clipping. Horizontal dashed lines indicate the 1% FAP for each dataset (overlapping for the three methods). The vertical dashed line and shaded region mark the expected orbital period of HD 102365 b (122.1 ± 0.3 days). No significant peak is observed at the planet’s period in either dataset.
Current usage metrics show cumulative count of Article Views (full-text article views including HTML views, PDF and ePub downloads, according to the available data) and Abstracts Views on Vision4Press platform.
Data correspond to usage on the plateform after 2015. The current usage metrics is available 48-96 hours after online publication and is updated daily on week days.
Initial download of the metrics may take a while.