Fig. 6
Download original image
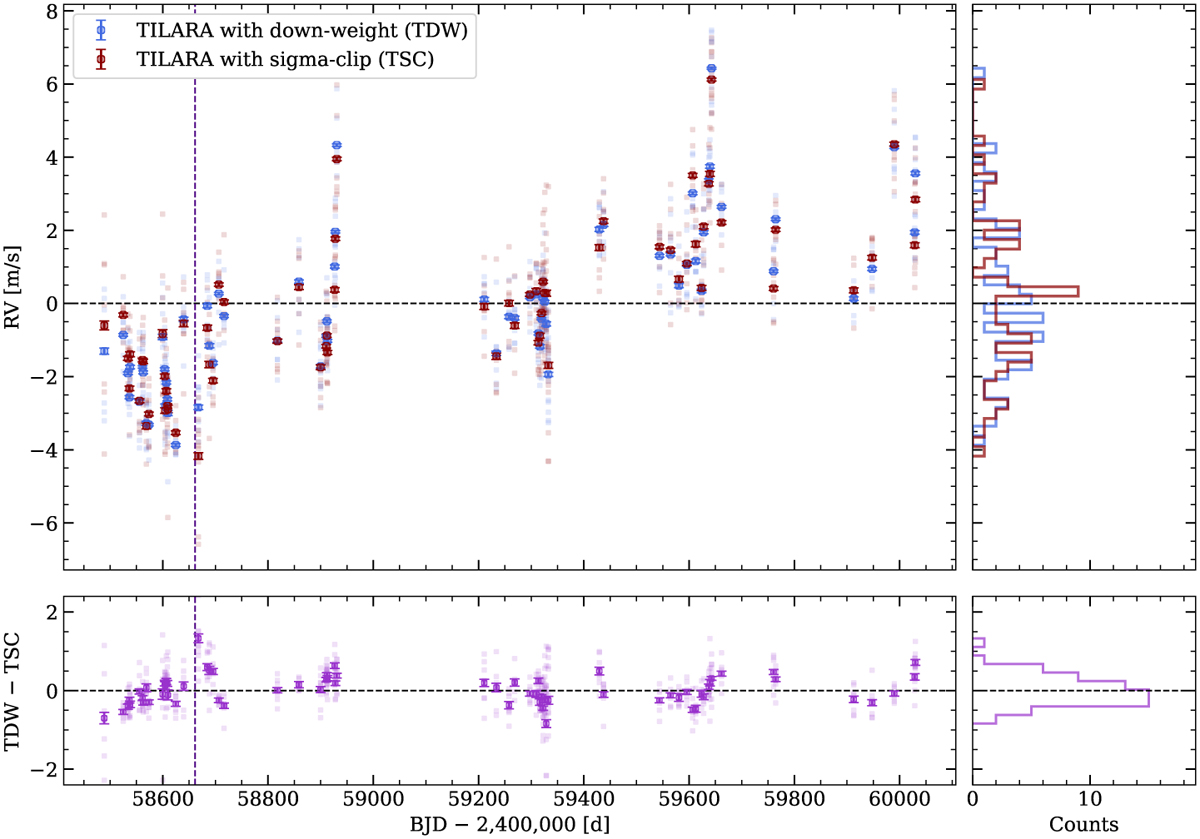
Top panel: comparison of RV time series obtained with the TILARA pipeline using two outlier-rejection strategies: sigma-clipping (TSC, red) and down-weighting (TDW, blue). Bright colored points correspond to nightly binned data, while the fainter points show the original unbinned measurements. The histogram on the right shows the RV distribution for each method. Bottom panel: residuals between both methods (TDW – TSC) as a function of BJD, with the associated residual distribution shown in the histogram. A vertical indigo line marks 27 June 2019, indicating the transition from ESPRESSO18 to ESPRESSO19.
Current usage metrics show cumulative count of Article Views (full-text article views including HTML views, PDF and ePub downloads, according to the available data) and Abstracts Views on Vision4Press platform.
Data correspond to usage on the plateform after 2015. The current usage metrics is available 48-96 hours after online publication and is updated daily on week days.
Initial download of the metrics may take a while.