Fig. 5
Download original image
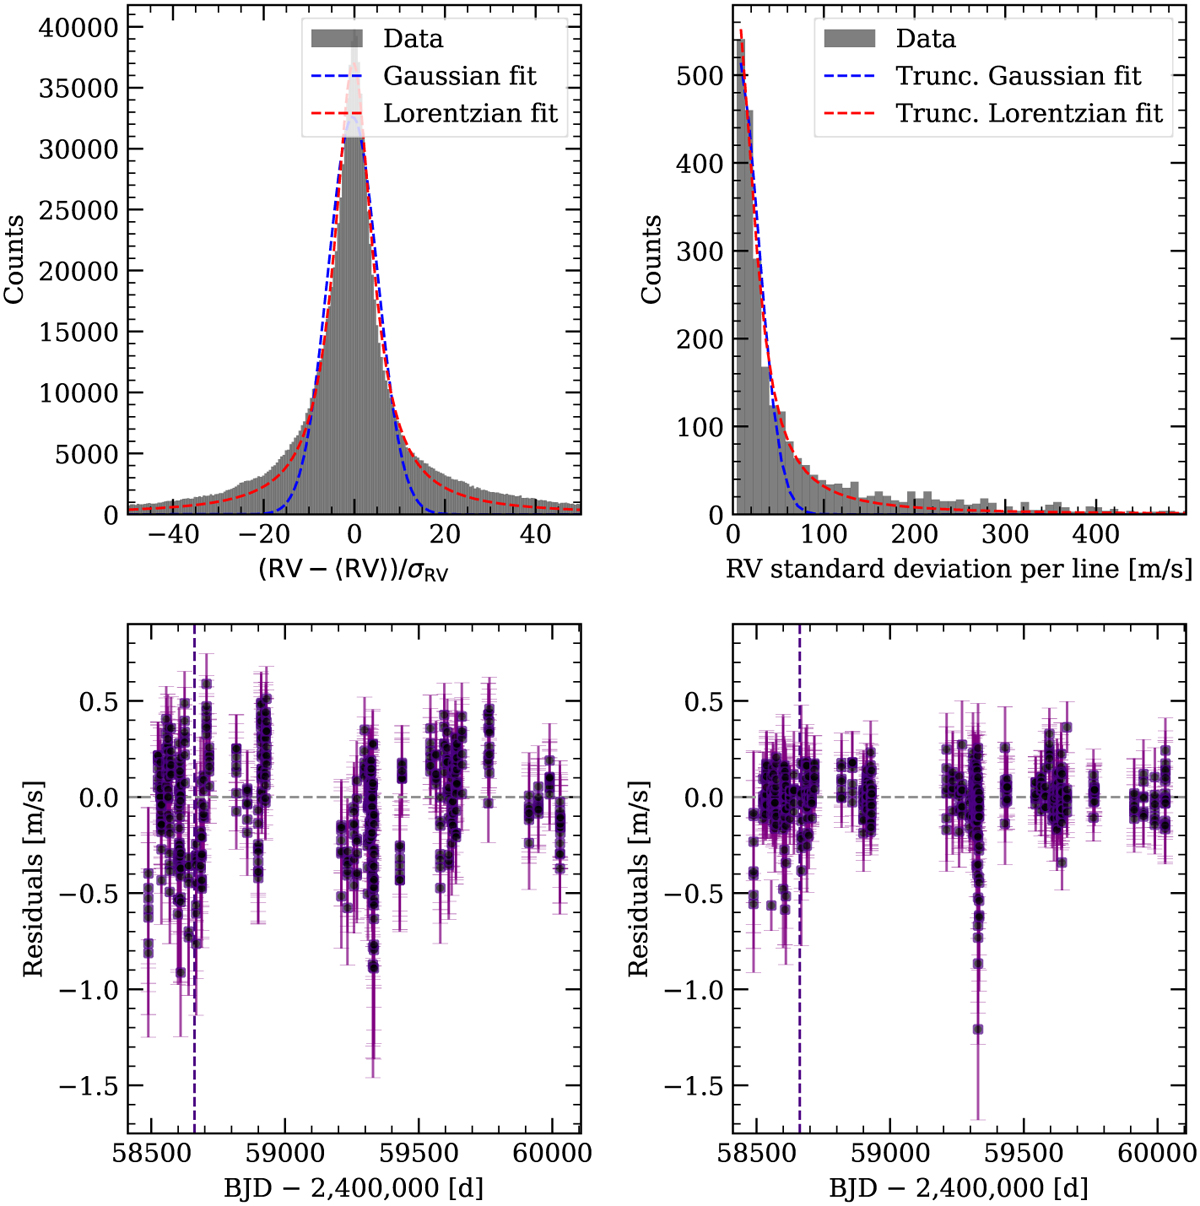
Summary of the down-weighting procedures tested for TILARA (for a detailed description see Appendix E). Top left panel: distribution of the RV values (mean-subtracted and σ-normalized) per observation with the best-fit Gaussian (blue) and Lorentzian (red) models. Top right panel: distribution of the RV standard deviation per line with truncated Gaussian and truncated Lorentzian fits. Bottom left panel: residual RV time series obtained by subtracting the RVs derived using a Lorentzian fit from those derived using a Gaussian fit. Bottom right panel: residual RV time series obtained by subtracting the RVs derived using a truncated Lorentzian fit from those derived using a truncated Gaussian fit. The vertical black line marks 27 June 2019, indicating the transition from ESPRESSO18 to ESPRESSO19.
Current usage metrics show cumulative count of Article Views (full-text article views including HTML views, PDF and ePub downloads, according to the available data) and Abstracts Views on Vision4Press platform.
Data correspond to usage on the plateform after 2015. The current usage metrics is available 48-96 hours after online publication and is updated daily on week days.
Initial download of the metrics may take a while.