Fig. 4
Download original image
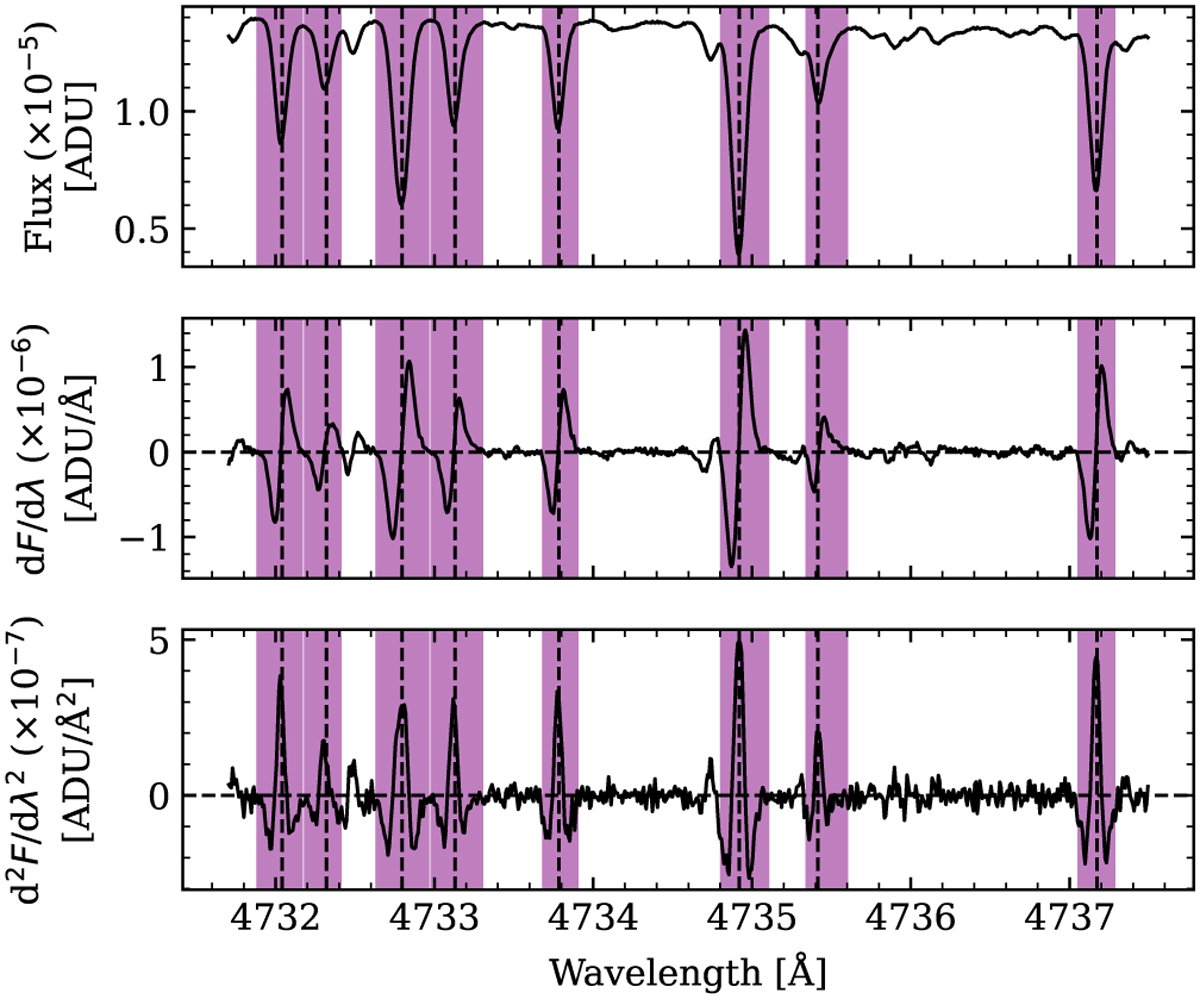
Top: part of the spectrum of one observation, with the reference line centers (from the solar line list) marked as dashed lines and the adopted line windows shown in purple. The observed line centers are slightly shifted relative to the solar reference due to differences in convective blueshift and gravitational redshift between the Sun and HD 102365. Middle: first derivative of the flux (dF/dλ), used to locate the extrema that define the window limits. Bottom: second derivative (d2F/dλ2), used to confirm the line minima (d2F/dλ2 < 0). The master spectrum includes 2738 lines.
Current usage metrics show cumulative count of Article Views (full-text article views including HTML views, PDF and ePub downloads, according to the available data) and Abstracts Views on Vision4Press platform.
Data correspond to usage on the plateform after 2015. The current usage metrics is available 48-96 hours after online publication and is updated daily on week days.
Initial download of the metrics may take a while.