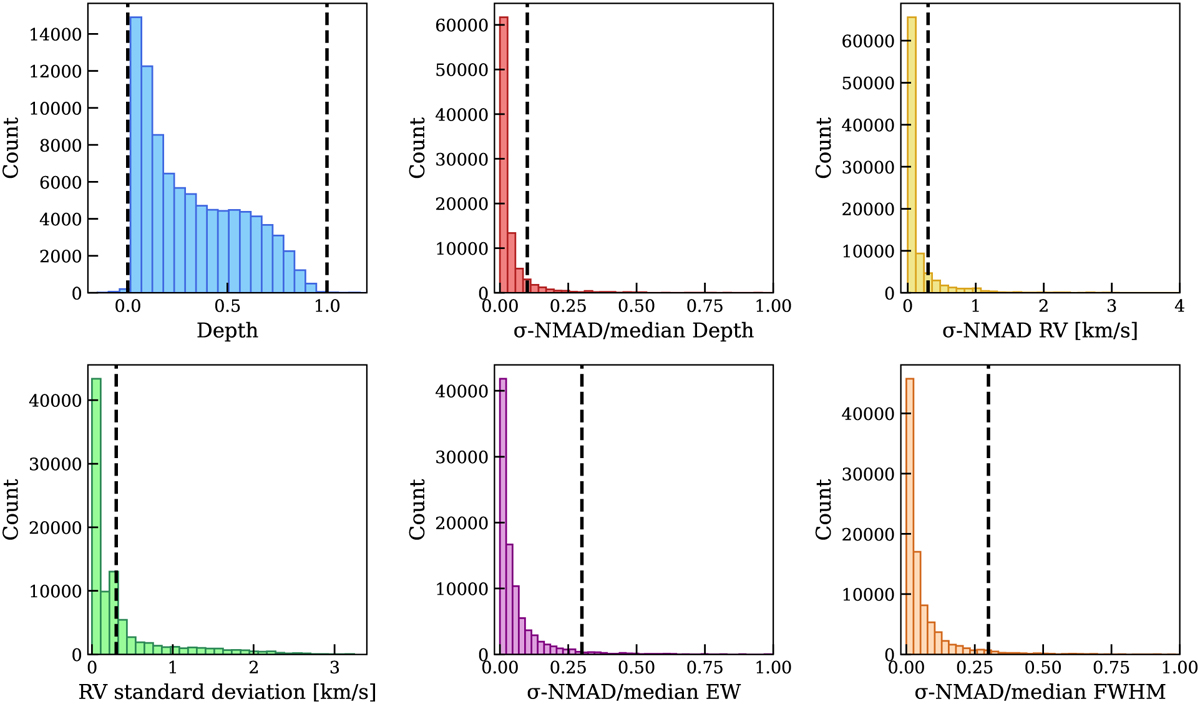
Fig. 3
Download original image
Distribution of the measured and derived properties of the final set of absorption lines used in the analysis. The panels show the depth, the σNMAD/median values (computed as (1.4826 × MAD)/median) for depth, EW, FWHM, and the σNMAD values (computed as 1.4826 × MAD) of the RV, as well as the standard deviation (σ) of the RV measurements across observations. Vertical dashed lines indicate the reference thresholds adopted during the line-selection process (0 and 1 for depth, 0.1 for the σNMAD/median of the depth, and 0.3 for the other parameters).
Current usage metrics show cumulative count of Article Views (full-text article views including HTML views, PDF and ePub downloads, according to the available data) and Abstracts Views on Vision4Press platform.
Data correspond to usage on the plateform after 2015. The current usage metrics is available 48-96 hours after online publication and is updated daily on week days.
Initial download of the metrics may take a while.