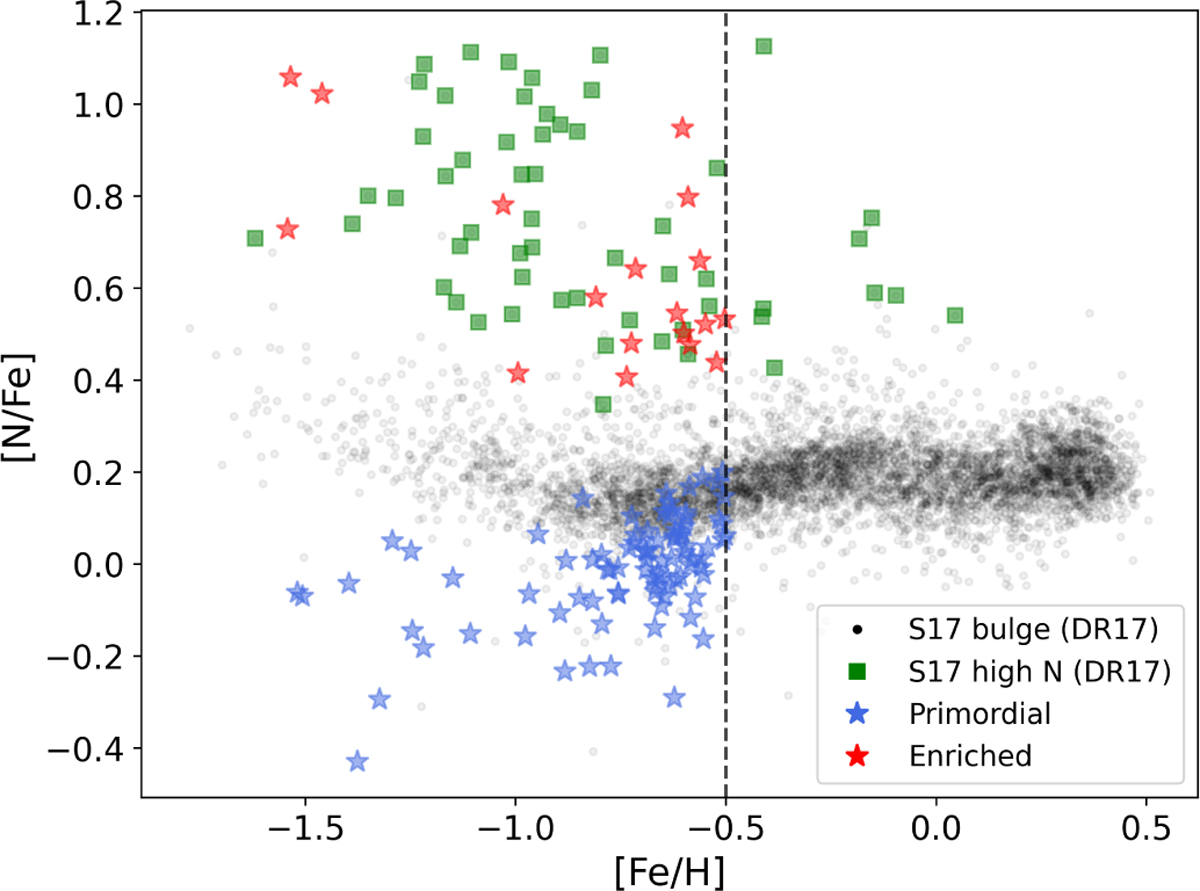
Fig. B.1
Download original image
Nitrogen abundance versus metallicity for our primordial (blue stars) and enriched (red stars) samples, as well as the bulge stars (black points) and nitrogen-rich stars (green squares) presented in Schiavon et al. (2017) (S17 - updated from APOGEE DR12 to DR17 abundances). The vertical dashed line represents the metallicity limit of our sample ([Fe/H] < −0. 5).
Current usage metrics show cumulative count of Article Views (full-text article views including HTML views, PDF and ePub downloads, according to the available data) and Abstracts Views on Vision4Press platform.
Data correspond to usage on the plateform after 2015. The current usage metrics is available 48-96 hours after online publication and is updated daily on week days.
Initial download of the metrics may take a while.