Fig. 2.
Download original image
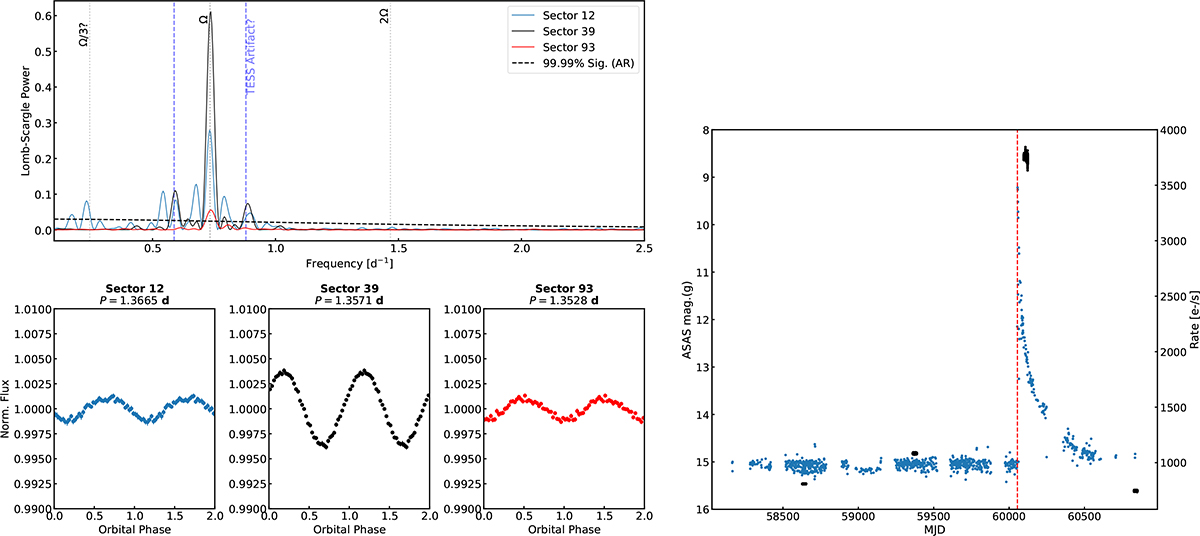
Top: Lomb-Scargle periodograms for V1716 Sco across Sectors 12, 39, and 93. The primary peak at ∼0.735 d−1 corresponds to the orbital frequency (Ω), with the first harmonic (2Ω) also visible at ∼1.47 d−1. The vertical dashed blue lines indicate potential instrumental artifacts related to the TESS orbital period (∼13.7 d) and its harmonics, which appear as sidebands to the main signal (Ω − 2ΩTESS; Ω + 2ΩTESS). The curved dashed black line represents the 99.99% significance threshold derived from an autoregressive [AR(p)] noise model. This frequency-dependent baseline accounts for the red-noise continuum (flickering) inherent in the system, which confirms that the orbital modulation remains statistically significant despite the increased noise power at low frequencies. Bottom left: Phase-folded light curve of Sectors 12, 39, and 93 at their detected orbital period, binned into 50 phase intervals to reduce point density and highlight the orbital modulation. Right: ASAS-SN g-band magnitude (blue points, left Y-axis) light curve of V1716 Sco before, during, and after the nova outburst recorded on MJD = 60055.178. The black points (right axis) show the raw TESS instrumental count rate. Note that the TESS Y-axis is independent and count rates are not scaled to the ASAS-SN g-band magnitude; sector-to-sector jumps in the TESS rate are due to varying background and crowding levels and do not affect the timing analysis.
Current usage metrics show cumulative count of Article Views (full-text article views including HTML views, PDF and ePub downloads, according to the available data) and Abstracts Views on Vision4Press platform.
Data correspond to usage on the plateform after 2015. The current usage metrics is available 48-96 hours after online publication and is updated daily on week days.
Initial download of the metrics may take a while.