Fig. 1.
Download original image
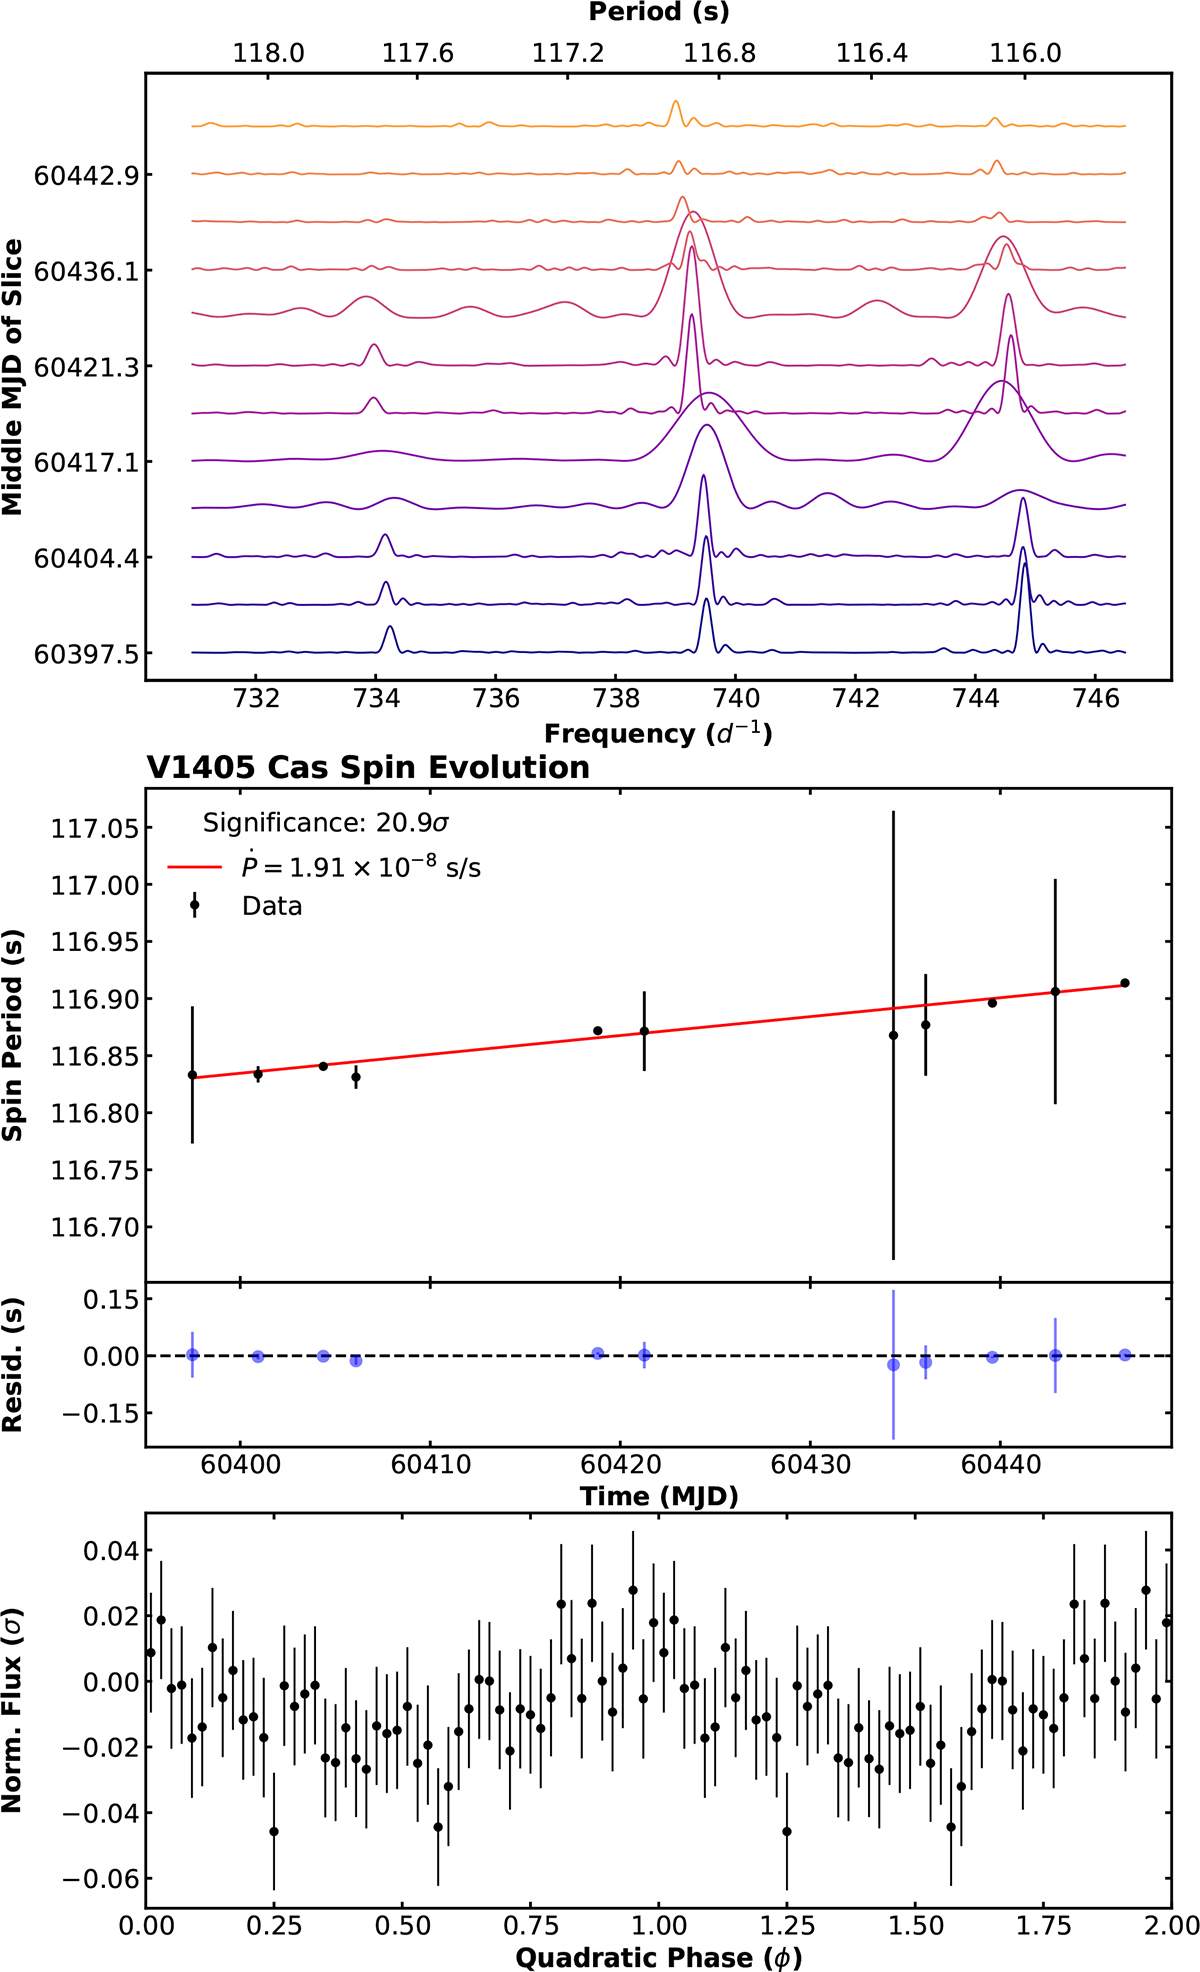
Top: Waterfall plot of stacked Lomb-Scargle periodograms. The right Y-axis indicates the middle MJD of each five-day slice, with the color gradient representing temporal progression. It illustrates the secular evolution of the spin frequency over the ∼56-day TESS observation baseline. Flanking the central period, two periods are observed that we identify as the beat periods between the orbital and spin periods (see Section 3.1). Middle: Evolution of the spin period as a function of time (MJD). The black points denote measurements from individual sliding windows, with 1σ uncertainties derived from 200-iteration Monte Carlo simulations integrated with an AR(p) red noise model. The red line represents a WLS linear fit, yielding a secular spin-down rate of Ṗ = 1.91 × 10⁻⁸±7.01 × 10⁻¹⁰ s/s, which represents a 20.9σ significance level over the constant hypothesis. The residuals of the linear period fit show no systematic trends or higher-order derivatives. Bottom: Pulse profile (50 bins) constructed via quadratic phase folding using the derived ephemeris (![]() ). The phase-folded profile is dominated by a broad, quasi-sinusoidal modulation. The successful recovery of this complex structure across the full TESS baseline confirms high phase coherence (Q = 1/|Ṗ| ≈ 5.2 × 10⁷) and validates the quadratic timing correction (Ṗ = 1.91 × 10⁻⁸ s/s).
). The phase-folded profile is dominated by a broad, quasi-sinusoidal modulation. The successful recovery of this complex structure across the full TESS baseline confirms high phase coherence (Q = 1/|Ṗ| ≈ 5.2 × 10⁷) and validates the quadratic timing correction (Ṗ = 1.91 × 10⁻⁸ s/s).
Current usage metrics show cumulative count of Article Views (full-text article views including HTML views, PDF and ePub downloads, according to the available data) and Abstracts Views on Vision4Press platform.
Data correspond to usage on the plateform after 2015. The current usage metrics is available 48-96 hours after online publication and is updated daily on week days.
Initial download of the metrics may take a while.