Fig. 9
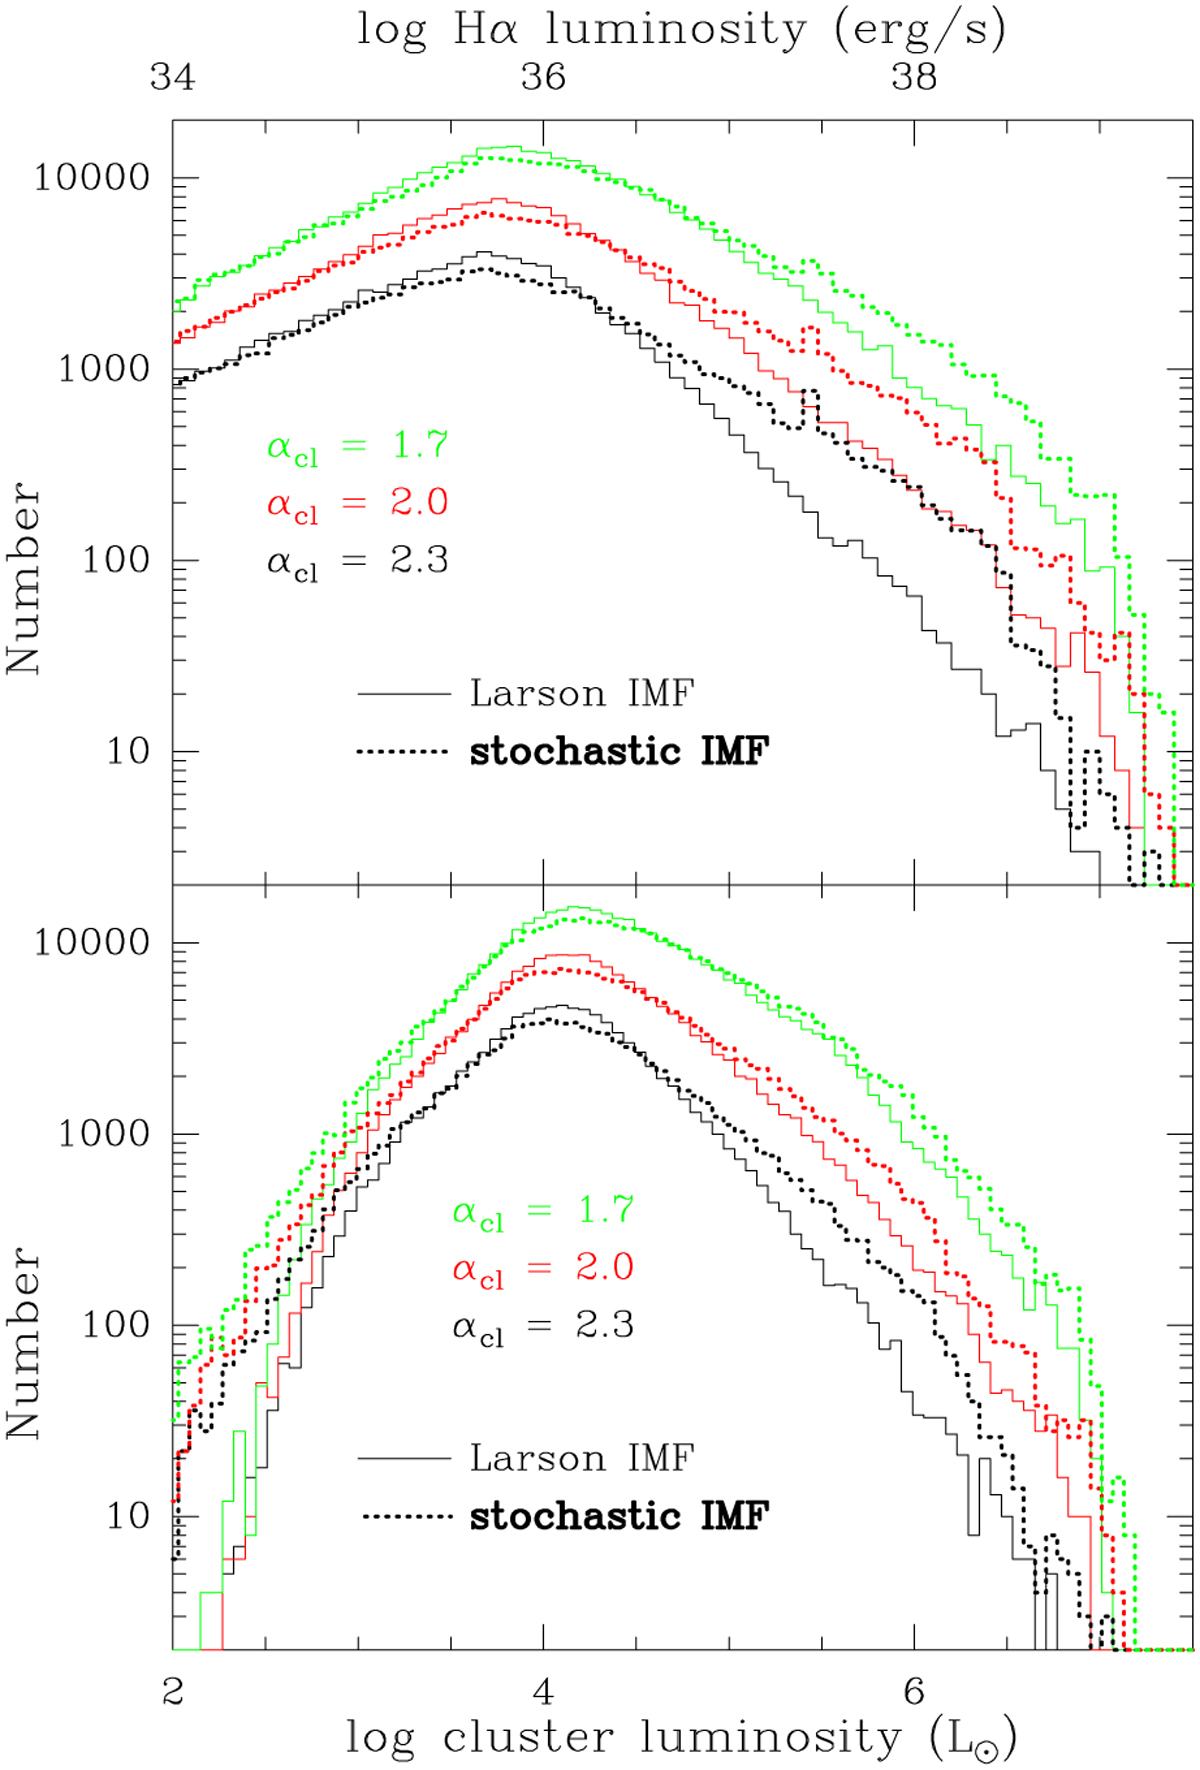
Download original image
Comparison of the distribution of cluster properties for a stochastic IMF (0.08-100 M⊙) with that derived for Larson’s model (Larson 1982) where the maximum stellar mass varies with the parent cloud mass. As in the previous figures, the cluster mass distribution is a pure power law with αcl = 1.7, 2.0, and 2.3 and Mclust = 0.03 Mcl. Cluster ages are attributed randomly as described in the text. The bolometric luminosities (bottom) and Hα luminosity (top) were then calculated for the stellar population at the age of each HII region. This figure can be directly compared with Fig. 8.
Current usage metrics show cumulative count of Article Views (full-text article views including HTML views, PDF and ePub downloads, according to the available data) and Abstracts Views on Vision4Press platform.
Data correspond to usage on the plateform after 2015. The current usage metrics is available 48-96 hours after online publication and is updated daily on week days.
Initial download of the metrics may take a while.