Fig. 8
Download original image
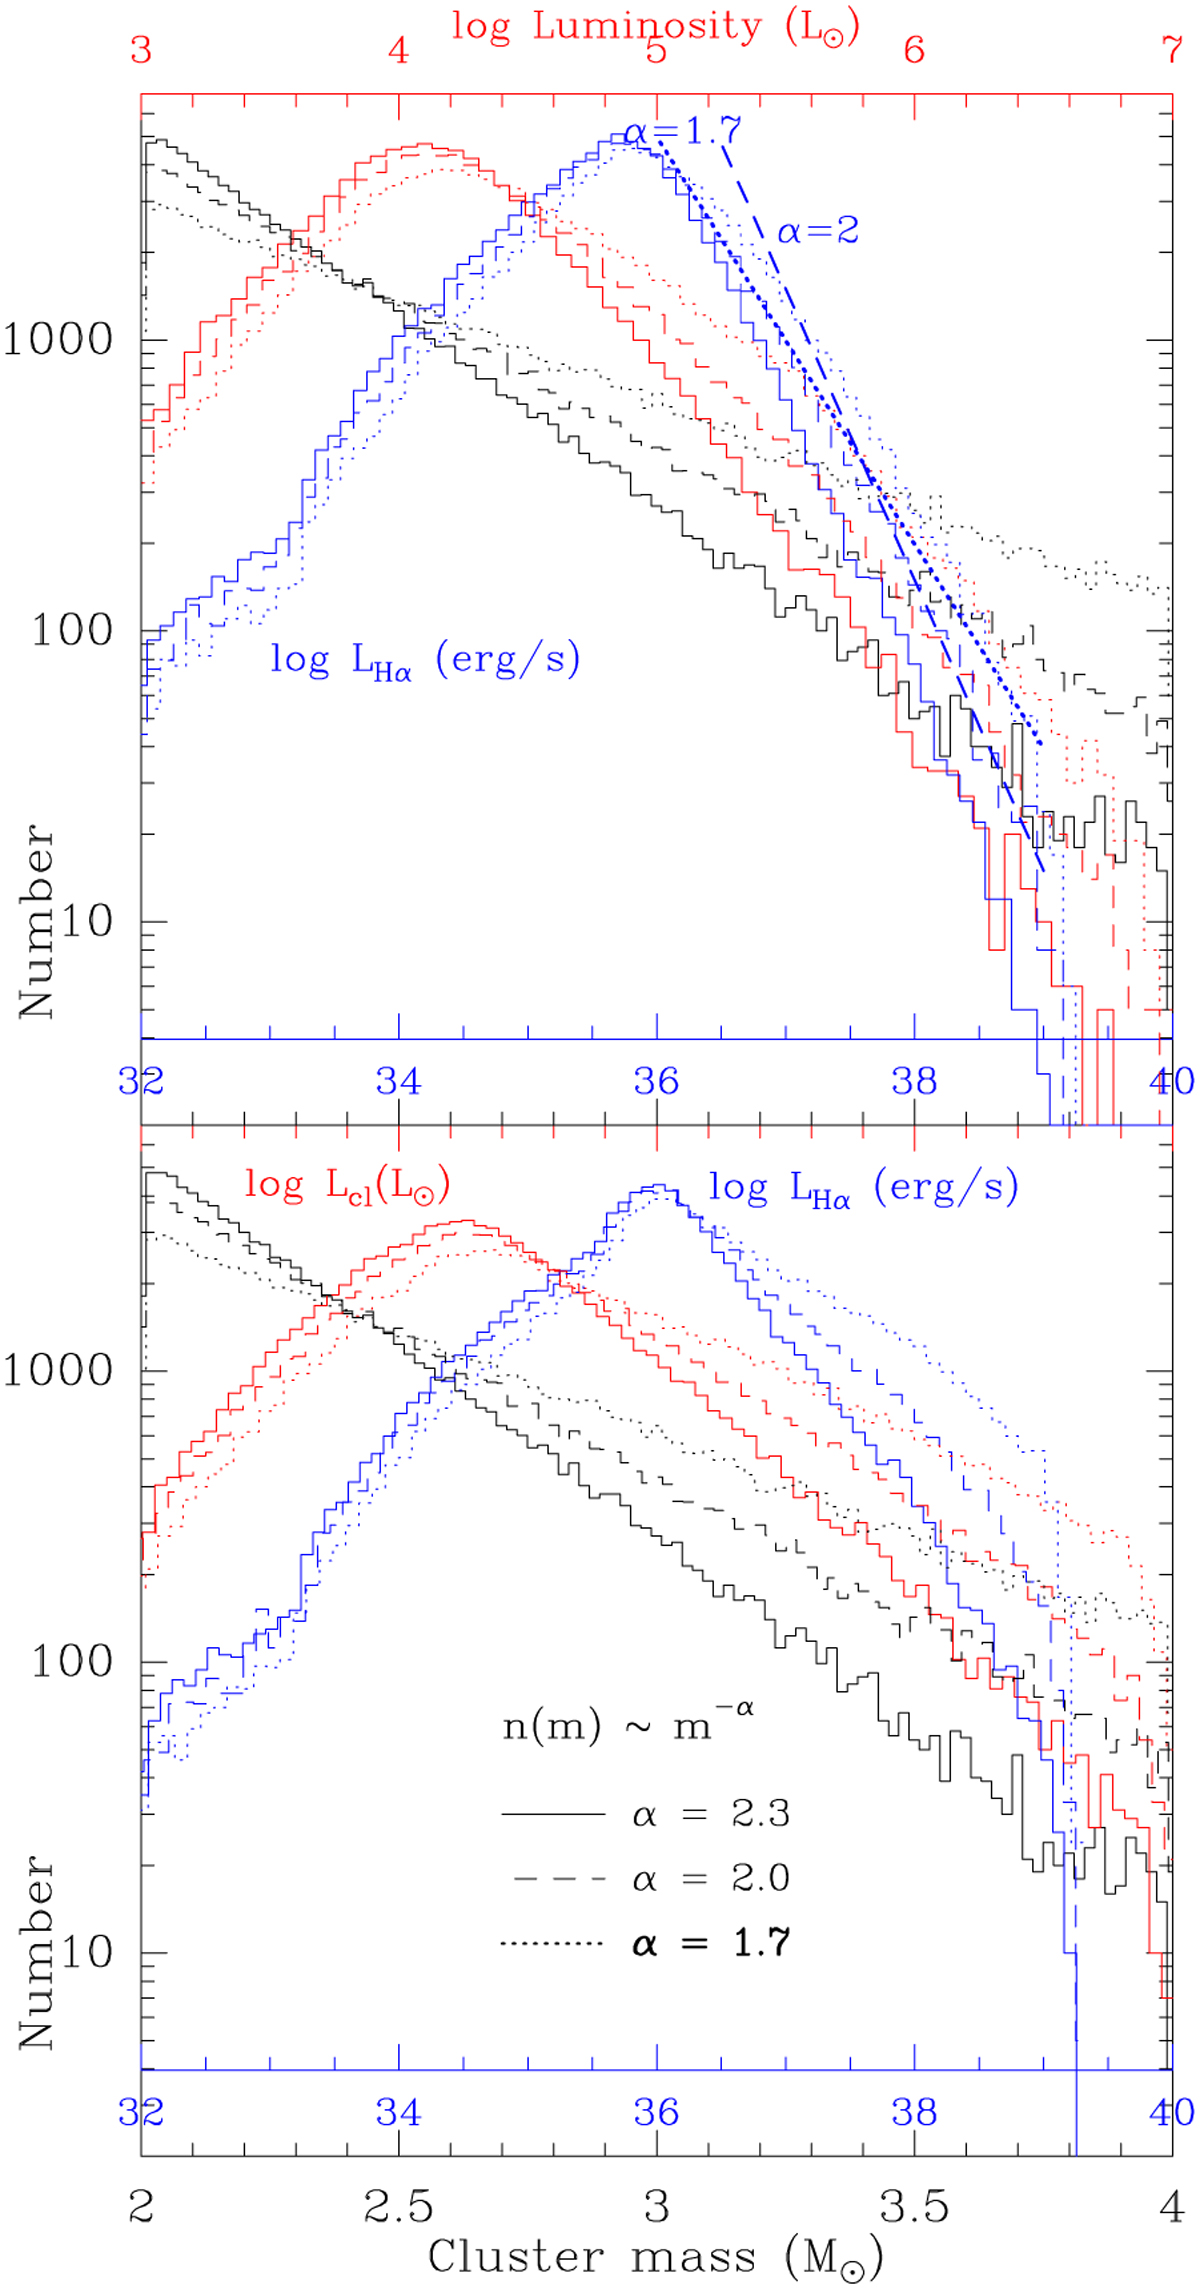
Like Figure 7 (zero-age in lower panel, random aging up to 15 Myr in upper panel) but the maximum stellar mass is as proposed by Larson (1982) (see Sect. 5.3). One of the main differences is the lack of the broad peak near 1038erg/s. The peak is due to the presence of a massive star in a small cluster, which is no longer possible with the Larson (1982) mass limit. While the cluster mass distribution is indeed a power law, the cluster luminosity and Nion function has an α that increases slowly with the minimal luminosity used in the fit, whether the Maschberger or powerlaw.py algorithm is used. This is seen as the curvature not present in the cluster mass distribution and is the result of the limiting stellar mass.
Current usage metrics show cumulative count of Article Views (full-text article views including HTML views, PDF and ePub downloads, according to the available data) and Abstracts Views on Vision4Press platform.
Data correspond to usage on the plateform after 2015. The current usage metrics is available 48-96 hours after online publication and is updated daily on week days.
Initial download of the metrics may take a while.