Fig. 7
Download original image
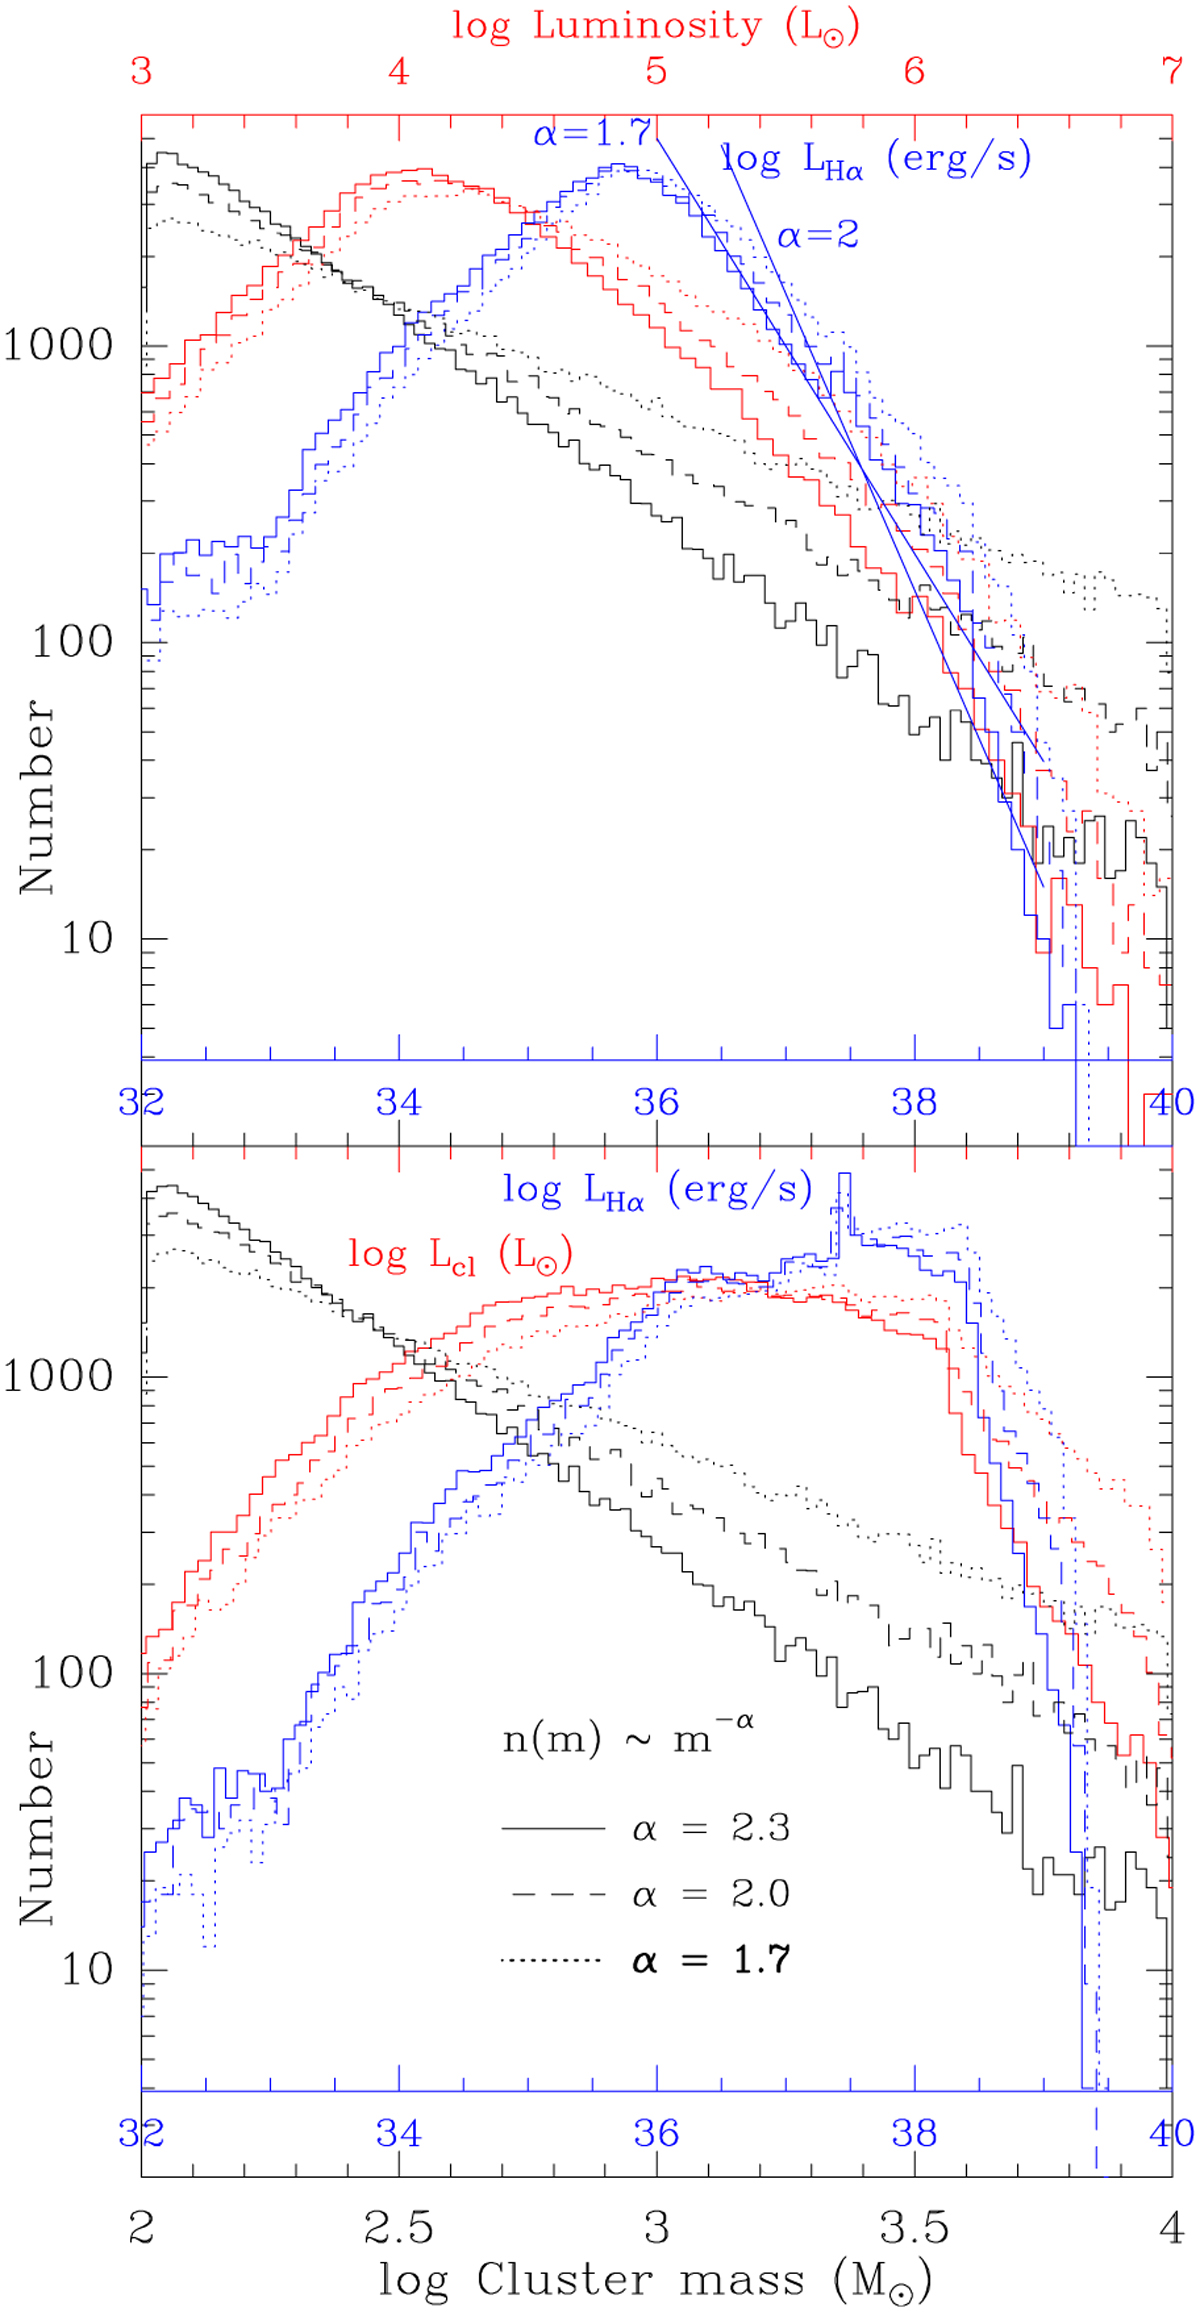
Histogram of simulated cluster properties assuming a “stochastic” IMF. Black lines represent the cluster masses, red lines show their luminosities, and blue lines are for the Hα luminosity. The zero-age IMF is shown in the lower panel and with aging as described in the text in the upper panel. The solid, dashed, and dotted lines show the results for the different cluster mass functions (αcl = 2.3, 2.0, 1.7), following the color above. Similarly, the red x-axis provides the cluster luminosities and the blue x-axis represents the Hα luminosity, both in logarithm. In the upper panel, two blue lines are shown with slopes of 1.7 and 2.0 to help guide the eye. We drew three sets of 30 000 clusters for each of the mass functions and, after checking that they yielded the same results, they were combined to further reduce any noise so the distributions are based on 90 000 clusters for each mass function. The Chabrier IMF was used with the Eker-Sternberg MLR.
Current usage metrics show cumulative count of Article Views (full-text article views including HTML views, PDF and ePub downloads, according to the available data) and Abstracts Views on Vision4Press platform.
Data correspond to usage on the plateform after 2015. The current usage metrics is available 48-96 hours after online publication and is updated daily on week days.
Initial download of the metrics may take a while.