Fig. 6
Download original image
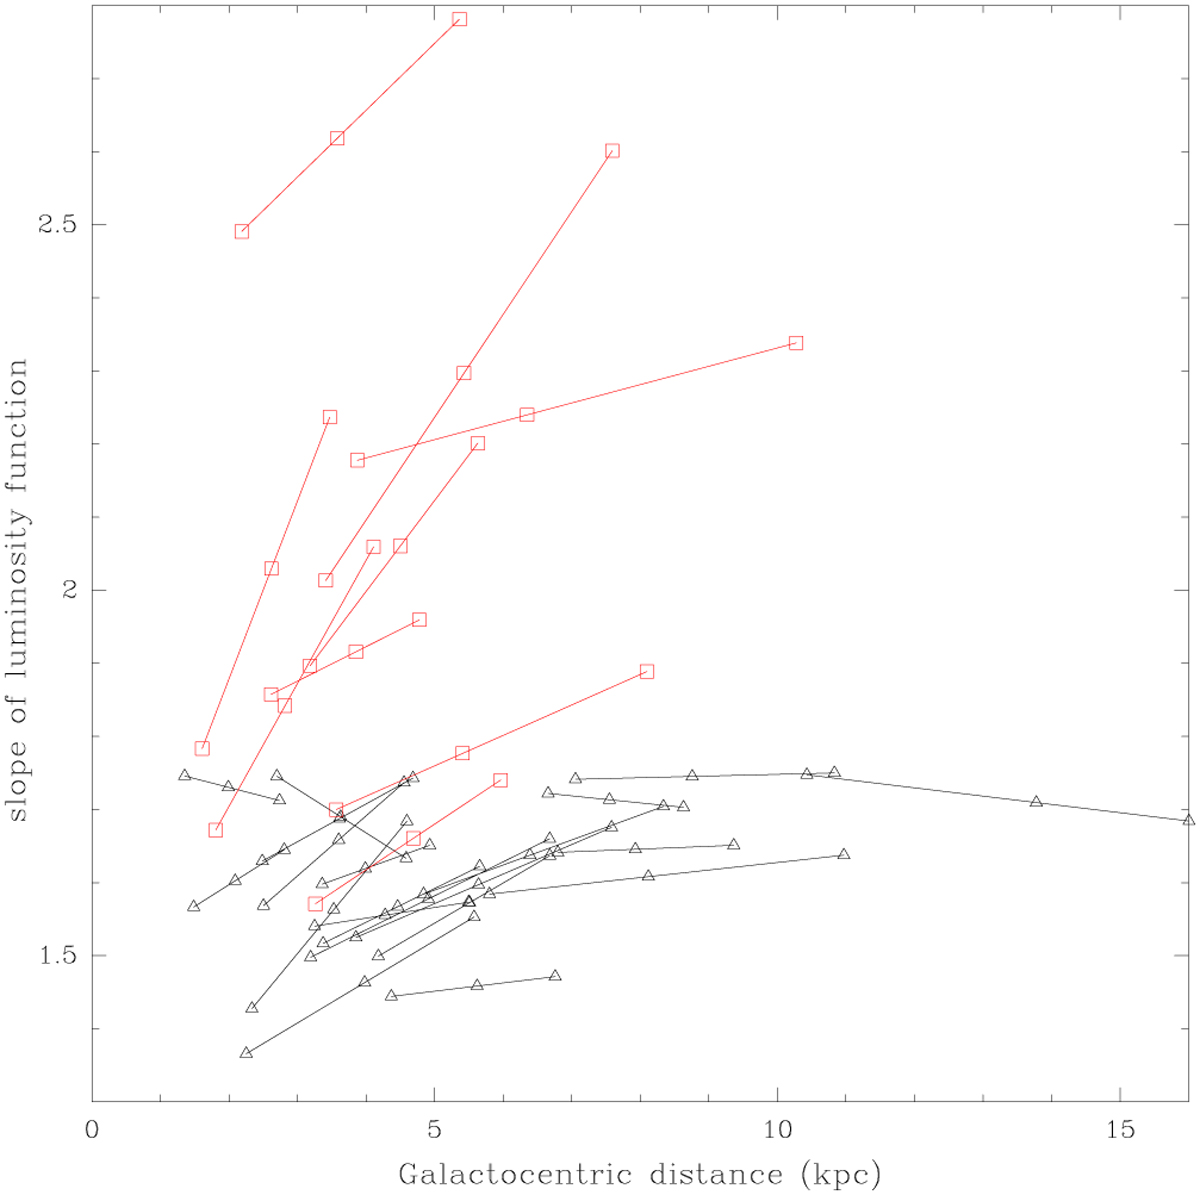
Radial variation of spectral indices. This plot portrays the latter four columns of Fig. 5 in a simpler fashion. The lines start with the median position of the inner regions (H II or GMC) and end at the median position of the outer regions. The marker near the line center indicates the median galactocentric distance of the whole sample, and column 5 of Tables 1 and 2 provides the correspondence with the optical radius R25. Red lines are GMC indices and black lines show the indices of the HII regions. When the line goes up, the spectral index in the outer part is higher because the distribution is steeper (relatively more small objects).
Current usage metrics show cumulative count of Article Views (full-text article views including HTML views, PDF and ePub downloads, according to the available data) and Abstracts Views on Vision4Press platform.
Data correspond to usage on the plateform after 2015. The current usage metrics is available 48-96 hours after online publication and is updated daily on week days.
Initial download of the metrics may take a while.