Fig. 5
Download original image
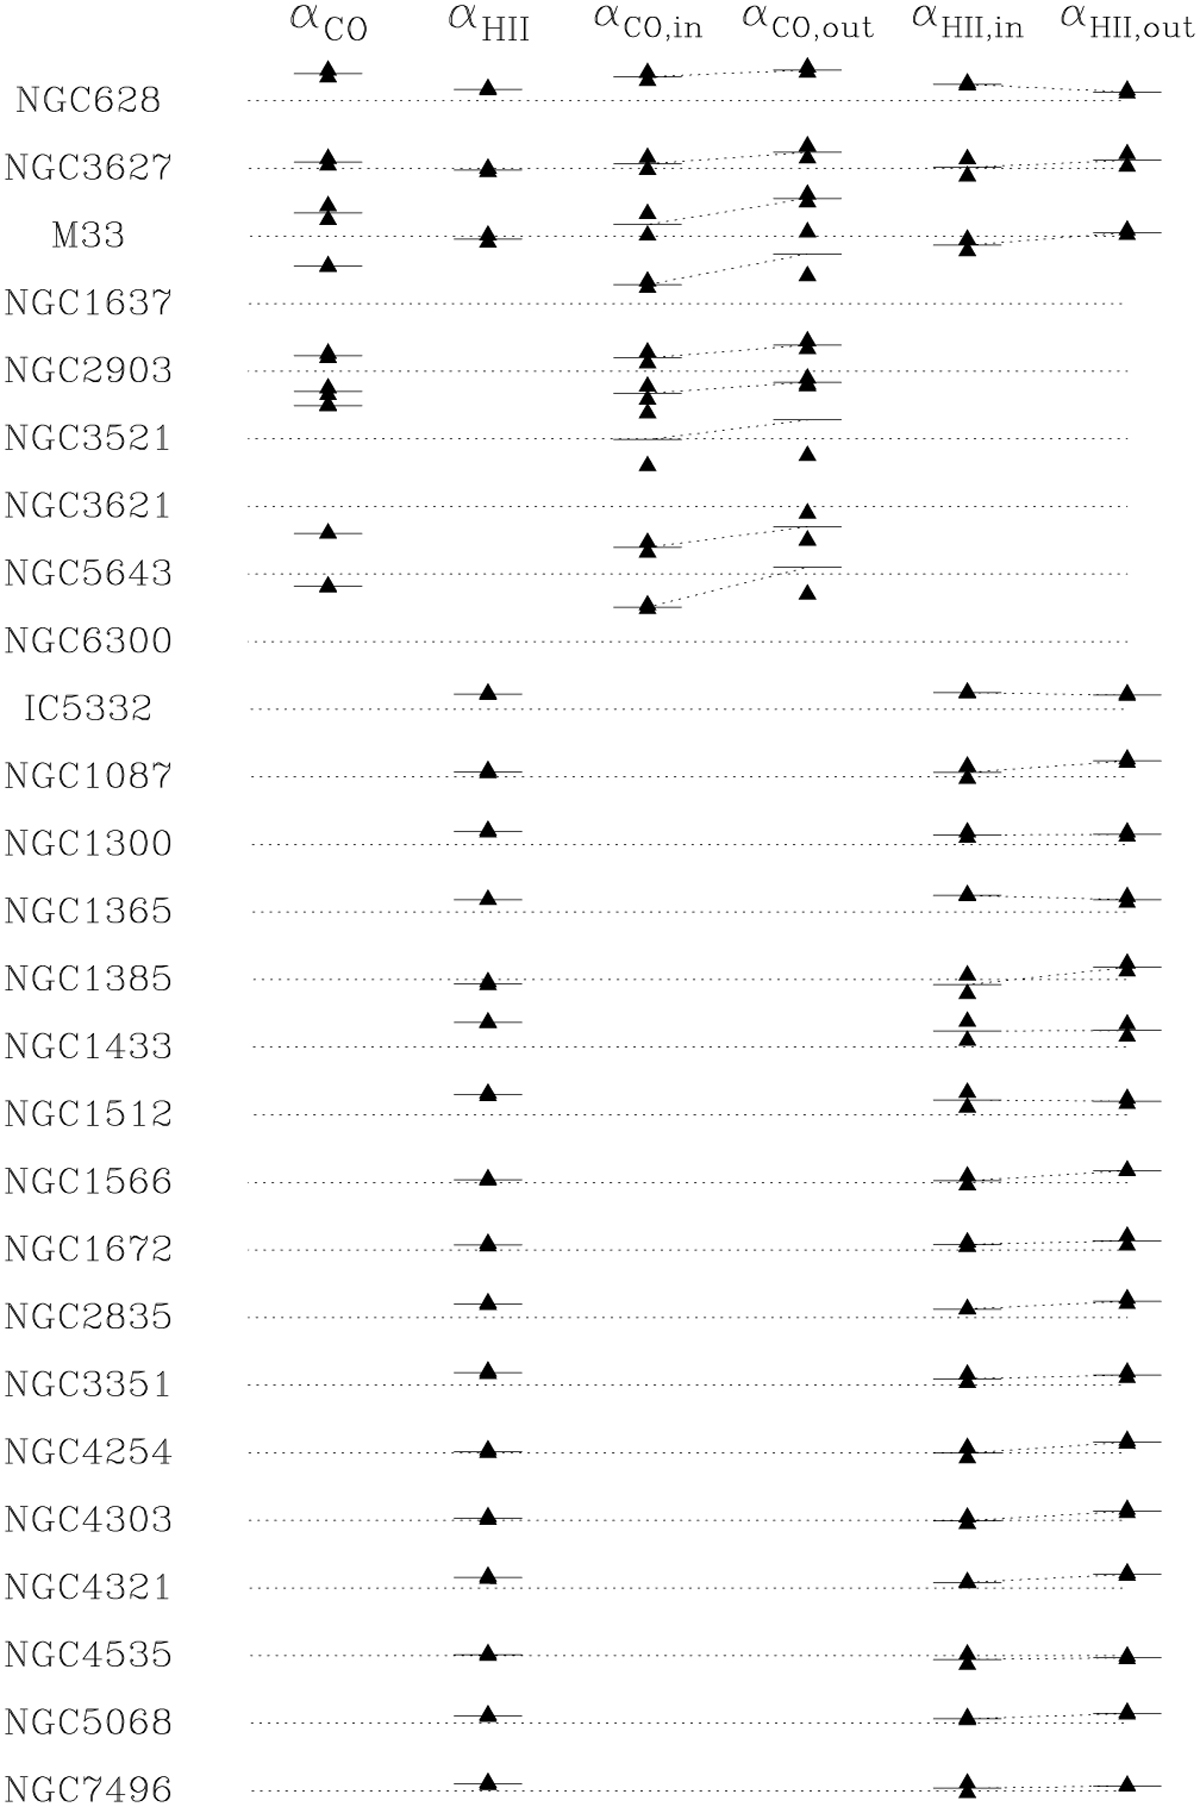
Results of fits to the distribution of Hα and CO luminosities. For each galaxy, the name is indicated followed by (1) the whole-galaxy GMC spectral index; (2) the whole-galaxy Hα spectral index; (3) the inner and outer GMC spectral index, connected by a line; and (4) the same but or the Hα luminosities of HII regions. In each case, the triangles indicate the values obtained from the two independent fitting methods and the average is shown by the short horizontal line. When the line goes up, the distribution in the outer part is steeper (relatively more small objects). A horizontal dashed line at a value of 1.5 is plotted to allow easy appraisal of the values.
Current usage metrics show cumulative count of Article Views (full-text article views including HTML views, PDF and ePub downloads, according to the available data) and Abstracts Views on Vision4Press platform.
Data correspond to usage on the plateform after 2015. The current usage metrics is available 48-96 hours after online publication and is updated daily on week days.
Initial download of the metrics may take a while.