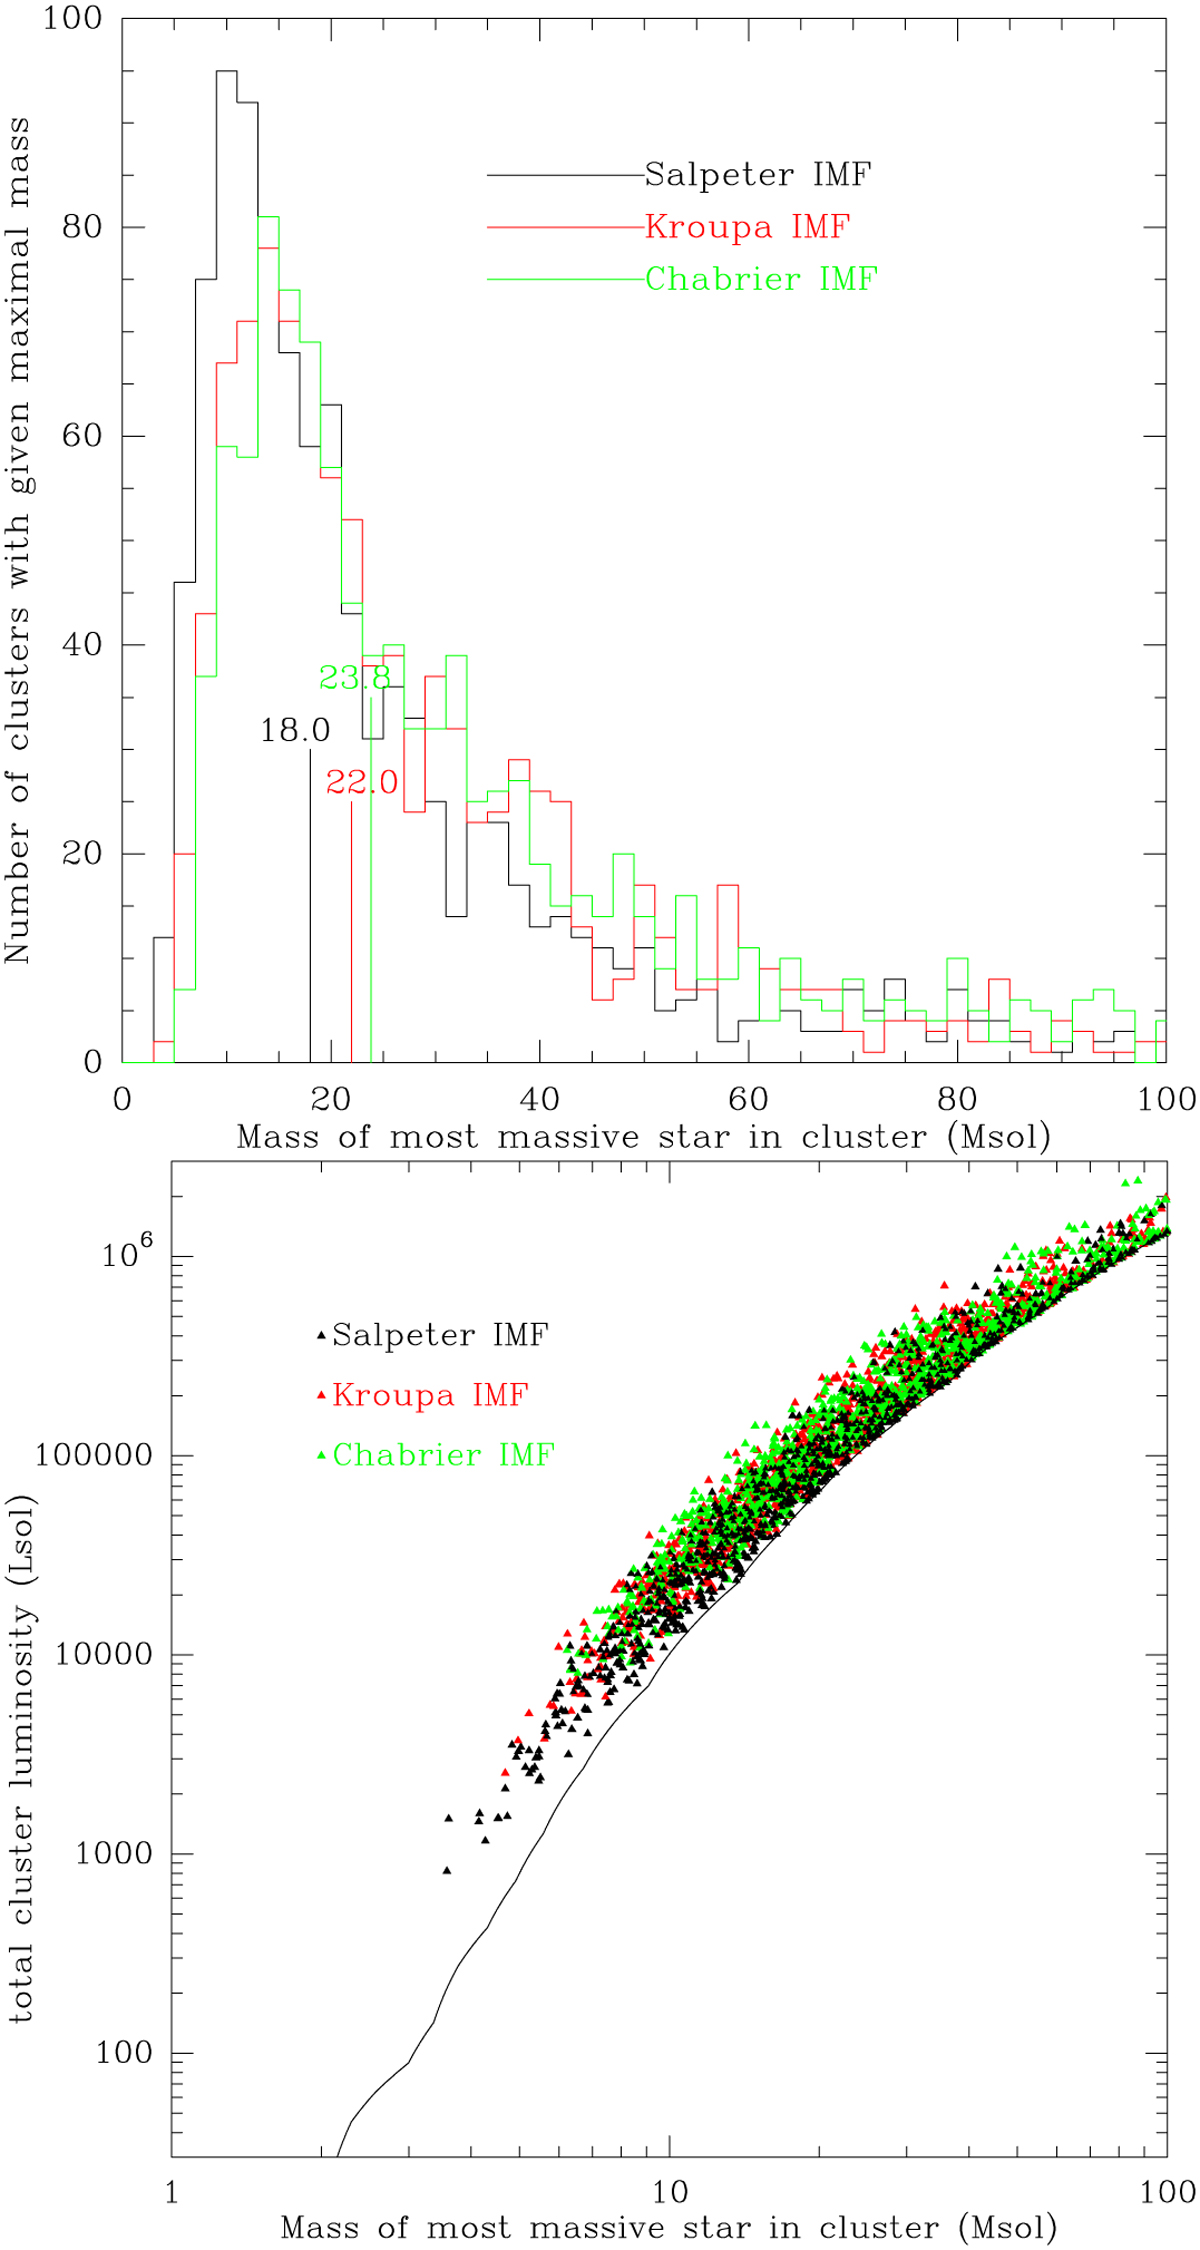
Fig. A.2
Download original image
The top panel shows the distribution of the masses of the most massive star in each cluster, with the median value indicated, for the 1000 simulated clusters of 300M⊙ each. These median values are close to the maximal value suggested by Larson (1982). Even for a cluster with 300M⊙ of stars, the random sampling effect is huge. The bottom panel shows the total cluster luminosity as a function of the mass of the most massive star, for the three IMFs indicated by their color. The line shows the luminosity of the single most massive star in the cluster. We can see (1) that the luminosity of a 300M⊙ cluster can vary by a factor 1000 and (2) how important the most massive star is for the total zero-age luminosity as when a very massive star is present, it dominates the luminosity (and ionizing photon production) of the cluster for its lifetime.
Current usage metrics show cumulative count of Article Views (full-text article views including HTML views, PDF and ePub downloads, according to the available data) and Abstracts Views on Vision4Press platform.
Data correspond to usage on the plateform after 2015. The current usage metrics is available 48-96 hours after online publication and is updated daily on week days.
Initial download of the metrics may take a while.