Open Access
Fig. 11
Download original image
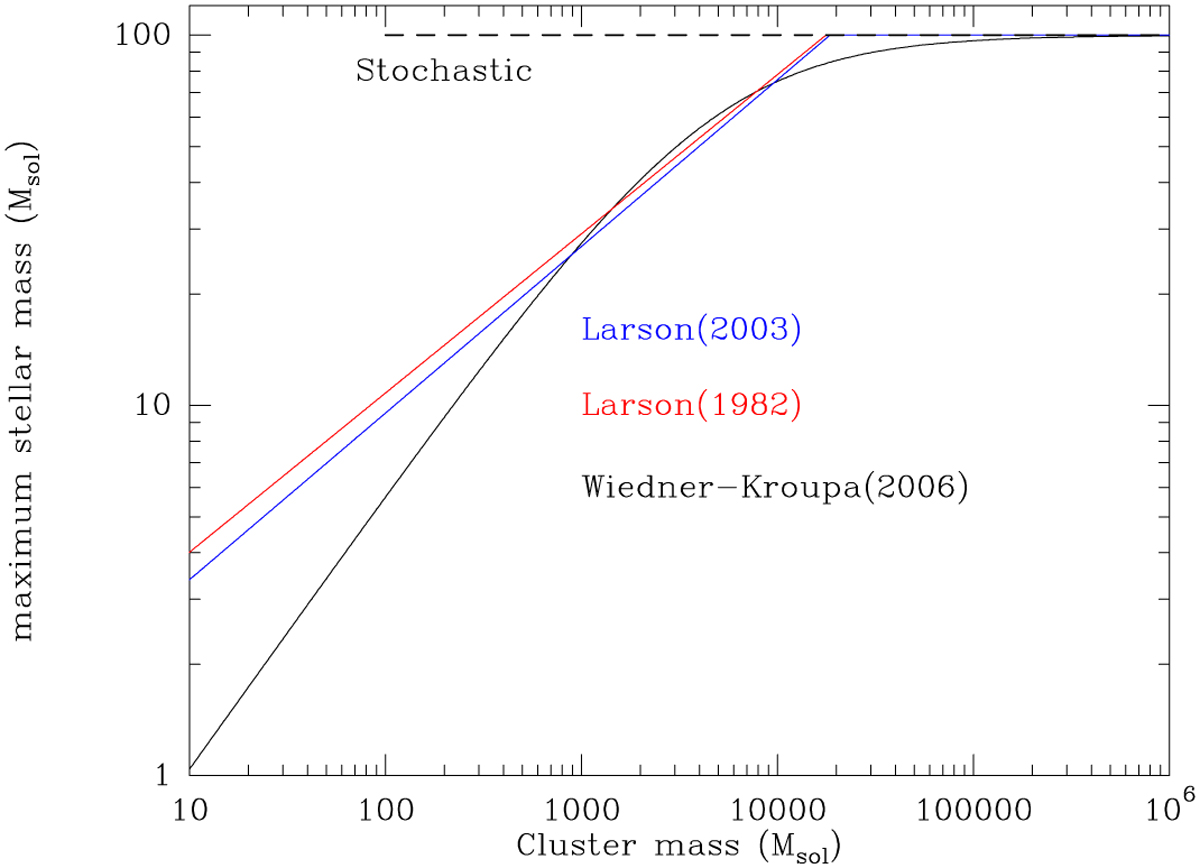
Comparison of the Larson (1982), Larson (2003), and Kroupa-Weidner (Weidner & Kroupa 2004, 2006) maximum stellar masses as in Weidner & Kroupa (2006) Fig. 1 but recalculated for the range in stellar masses used here (0.08-100 M⊙) and a Chabrier IMF. The dashed line at 100 M⊙ gives the “stochastic” mass limit.
Current usage metrics show cumulative count of Article Views (full-text article views including HTML views, PDF and ePub downloads, according to the available data) and Abstracts Views on Vision4Press platform.
Data correspond to usage on the plateform after 2015. The current usage metrics is available 48-96 hours after online publication and is updated daily on week days.
Initial download of the metrics may take a while.