Open Access
Fig. 10
Download original image
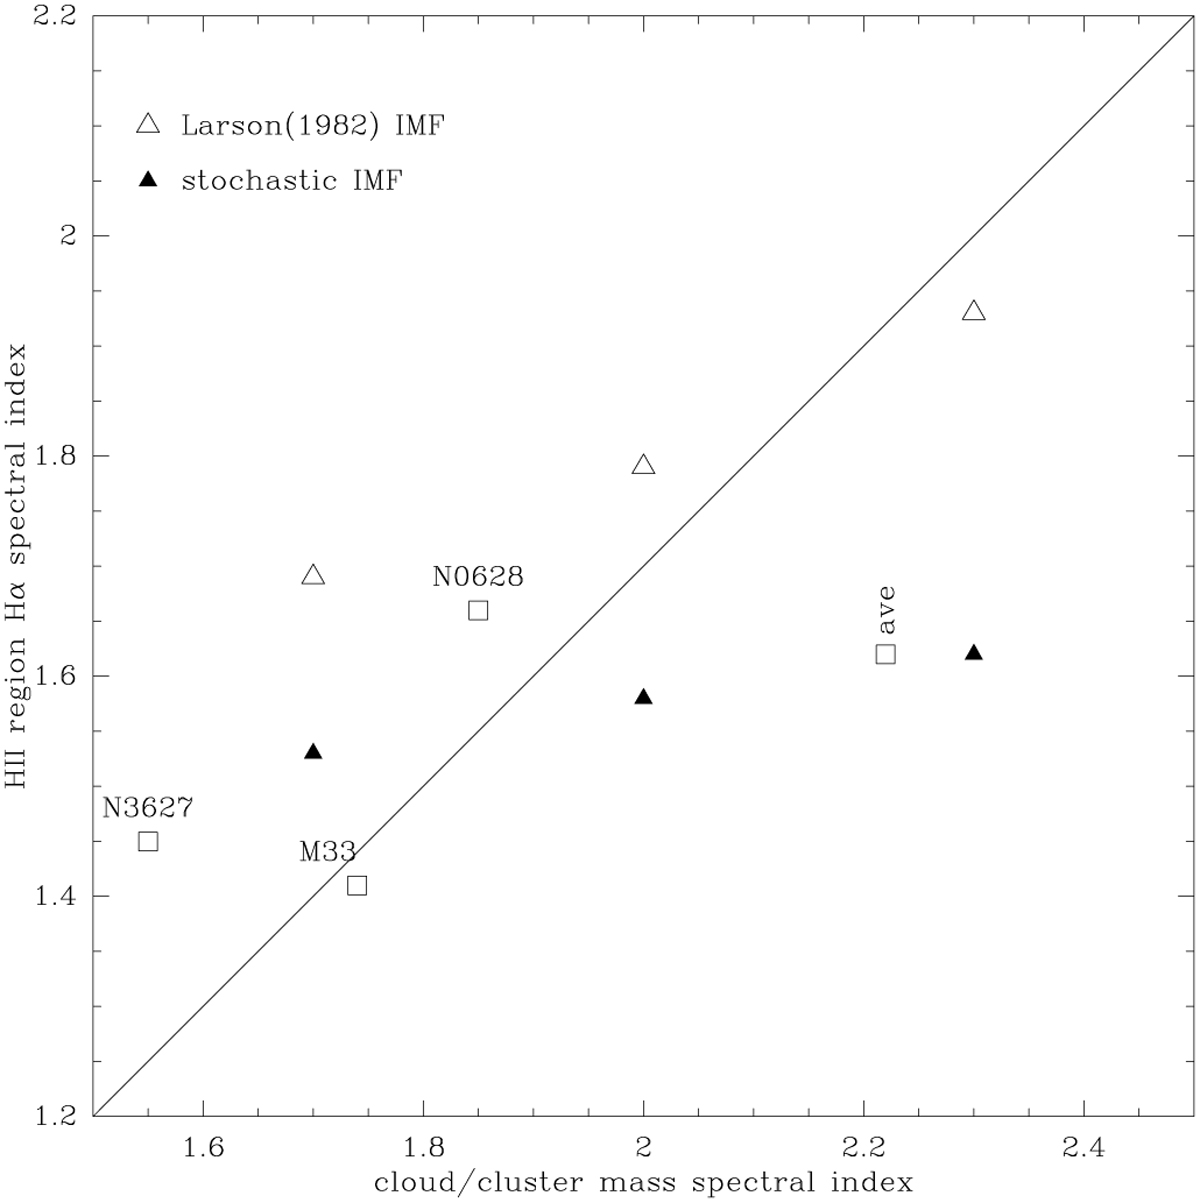
Comparison of the observed GMC spectral index and HII region Hα luminosity spectral index with the simulations using the stochastic and Larson (1982) limited IMFs. The point marked “ave” represents the average of the galaxies observed in Hα but not in CO plotted with the average of the galaxies observed in CO but not Hα.
Current usage metrics show cumulative count of Article Views (full-text article views including HTML views, PDF and ePub downloads, according to the available data) and Abstracts Views on Vision4Press platform.
Data correspond to usage on the plateform after 2015. The current usage metrics is available 48-96 hours after online publication and is updated daily on week days.
Initial download of the metrics may take a while.