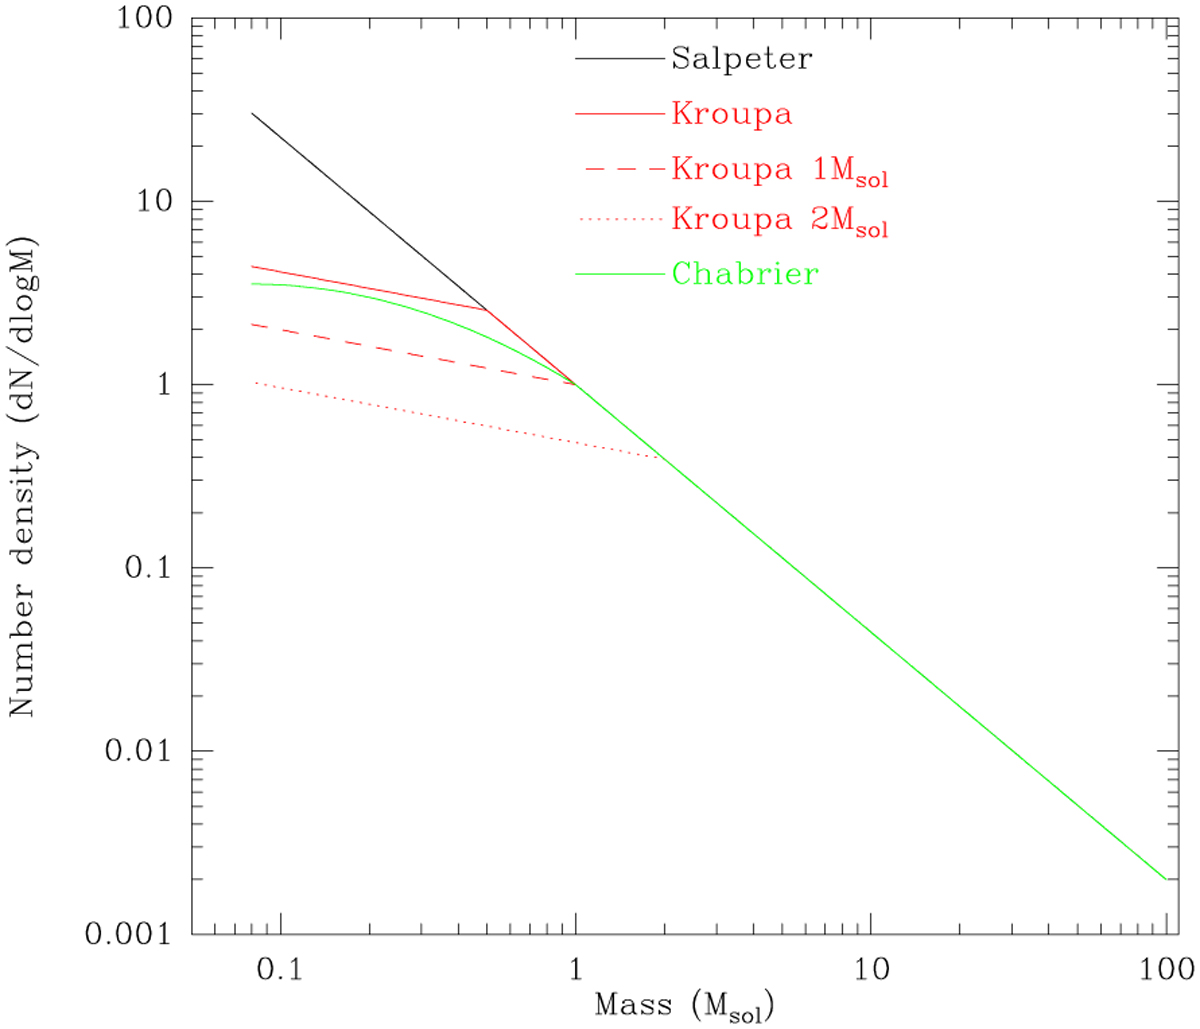
Fig. 1
Download original image
Initial mass functions used in this work. Black line is for Salpeter, red is for Kroupa, and green is for the Chabrier IMF. The plot shows the number of stars per logarithmic mass interval for each mass. Clearly, the Kroupa and Chabrier IMFs are similar and have significantly fewer low-mass stars than the Salpeter IMF. The dashed and dotted lines show the Kroupa IMF using somewhat higher characteristic masses. The effect of increasing the characteristic mass is that there are fewer low mass stars so the L/M ratio of the stellar population increases from about 900 L⊙/M⊙ to 1500 L⊙/M⊙.
Current usage metrics show cumulative count of Article Views (full-text article views including HTML views, PDF and ePub downloads, according to the available data) and Abstracts Views on Vision4Press platform.
Data correspond to usage on the plateform after 2015. The current usage metrics is available 48-96 hours after online publication and is updated daily on week days.
Initial download of the metrics may take a while.