Fig. E.1
Download original image
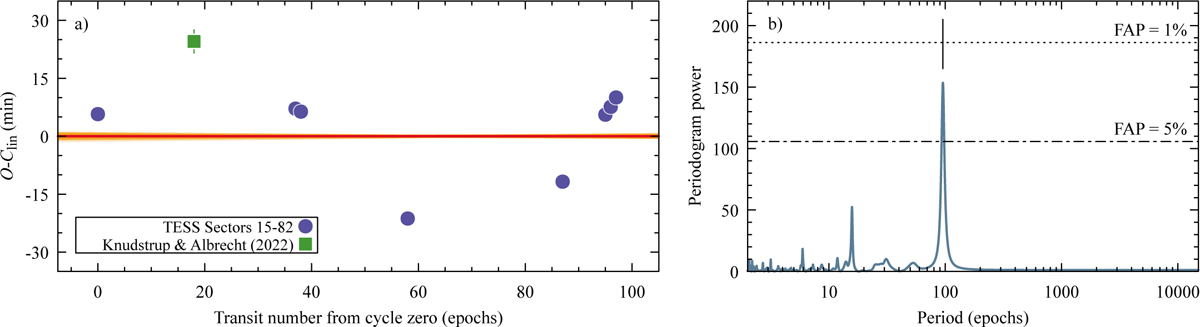
Results of the preliminary analysis of the transit-timing dataset. Panel a: Transit-timing residuals relative to a trial linear ephemeris. The symbol coding follows that in Fig. 2 and is explained in the legend. Timing uncertainties for the TESS data are smaller than the symbol size. The uncertainty of the trial ephemeris is illustrated by 100 posterior realisations, shown in orange. Panel b: AoV periodogram of the residuals obtained after subtracting the refined linear ephemeris shown in panel a. Horizontal lines indicate the false-alarm probability (FAP) levels, estimated using a bootstrap procedure applied to 100 000 resampled datasets. The strongest peak, near 96 epochs, has a FAP of 1.9% and is marked by a vertical line. Several harmonics of this signal are also visible.
Current usage metrics show cumulative count of Article Views (full-text article views including HTML views, PDF and ePub downloads, according to the available data) and Abstracts Views on Vision4Press platform.
Data correspond to usage on the plateform after 2015. The current usage metrics is available 48-96 hours after online publication and is updated daily on week days.
Initial download of the metrics may take a while.