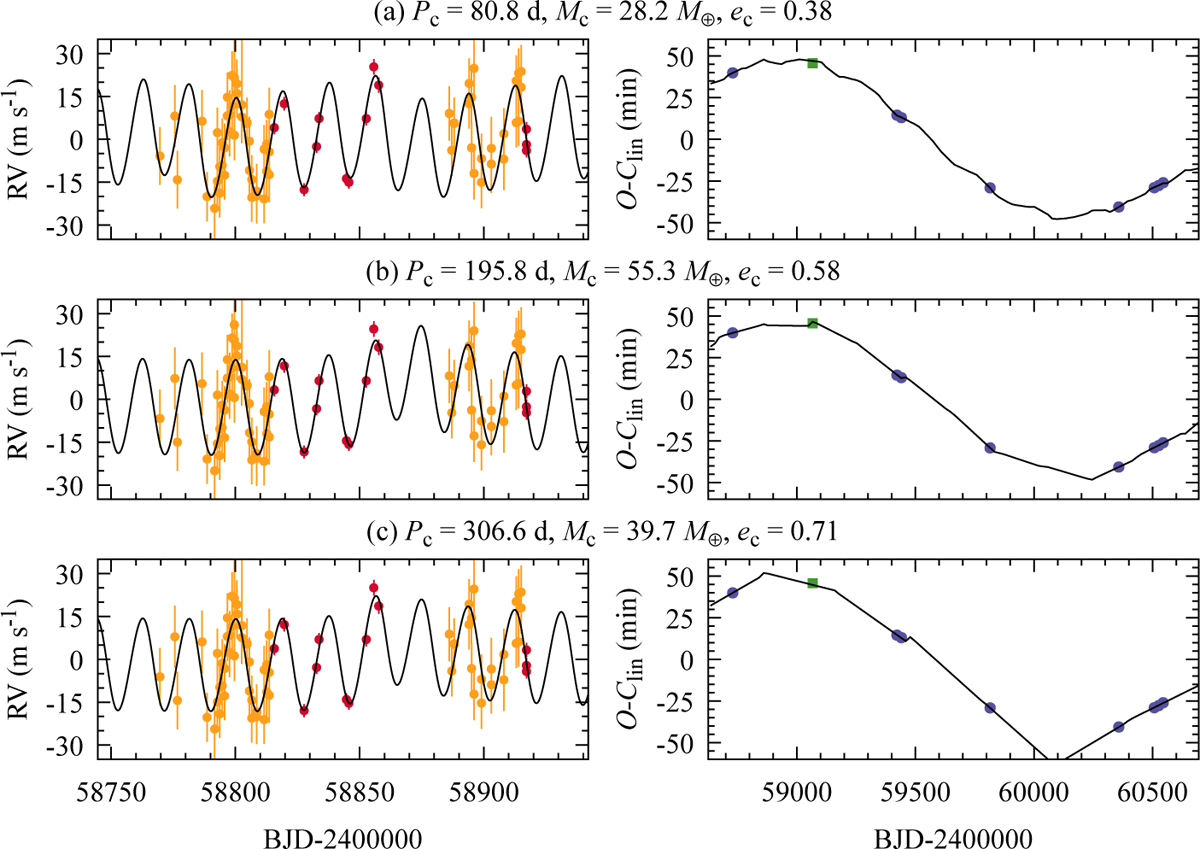
Fig. 4
Download original image
Comparison of three illustrative two-planet dynamical models fitted to HD 332231. Each row corresponds to a different perturber configuration with orbital periods of about 81 days (a), 196 days (b), and 307 days (c); the corresponding masses and orbital eccentricities are also provided. Left panels: modelled RV signals overlaid on HIRES and APF data points (red and orange points, respectively). Right panels: corresponding TTV model compared to observed mid-transit times. In analogy to Fig. 2, blue points come from TESS light curves, and the green square is from spectral observations by Knudstrup & Albrecht (2022).
Current usage metrics show cumulative count of Article Views (full-text article views including HTML views, PDF and ePub downloads, according to the available data) and Abstracts Views on Vision4Press platform.
Data correspond to usage on the plateform after 2015. The current usage metrics is available 48-96 hours after online publication and is updated daily on week days.
Initial download of the metrics may take a while.