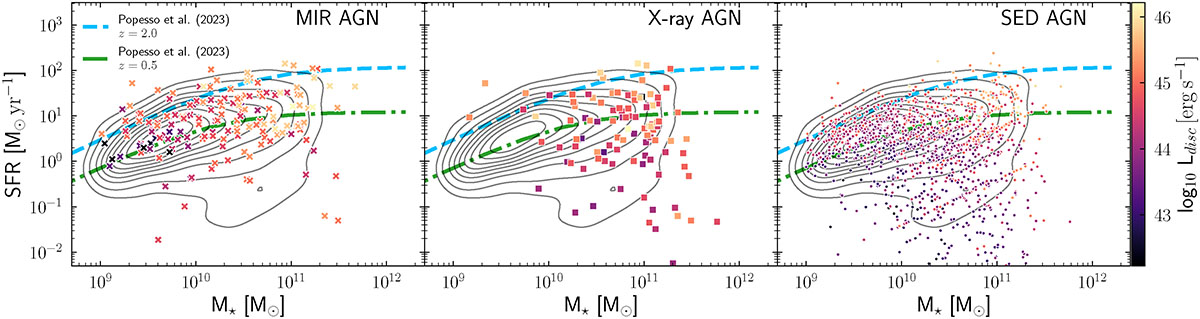
Fig. D.1.
Download original image
Contour plot illustrating the SFR vs M★ population distribution divided by AGN type, colour-coded by the AGN disc luminosity (Ldisc). In each panel, the contours (from 10% to 90%, with intervals of 10%) represent the non-AGN distribution. The dashed blue and the dash-dotted green lines indicate the MS at z = 2 and z = 0.5 from Popesso et al. (2023), respectively.
Current usage metrics show cumulative count of Article Views (full-text article views including HTML views, PDF and ePub downloads, according to the available data) and Abstracts Views on Vision4Press platform.
Data correspond to usage on the plateform after 2015. The current usage metrics is available 48-96 hours after online publication and is updated daily on week days.
Initial download of the metrics may take a while.