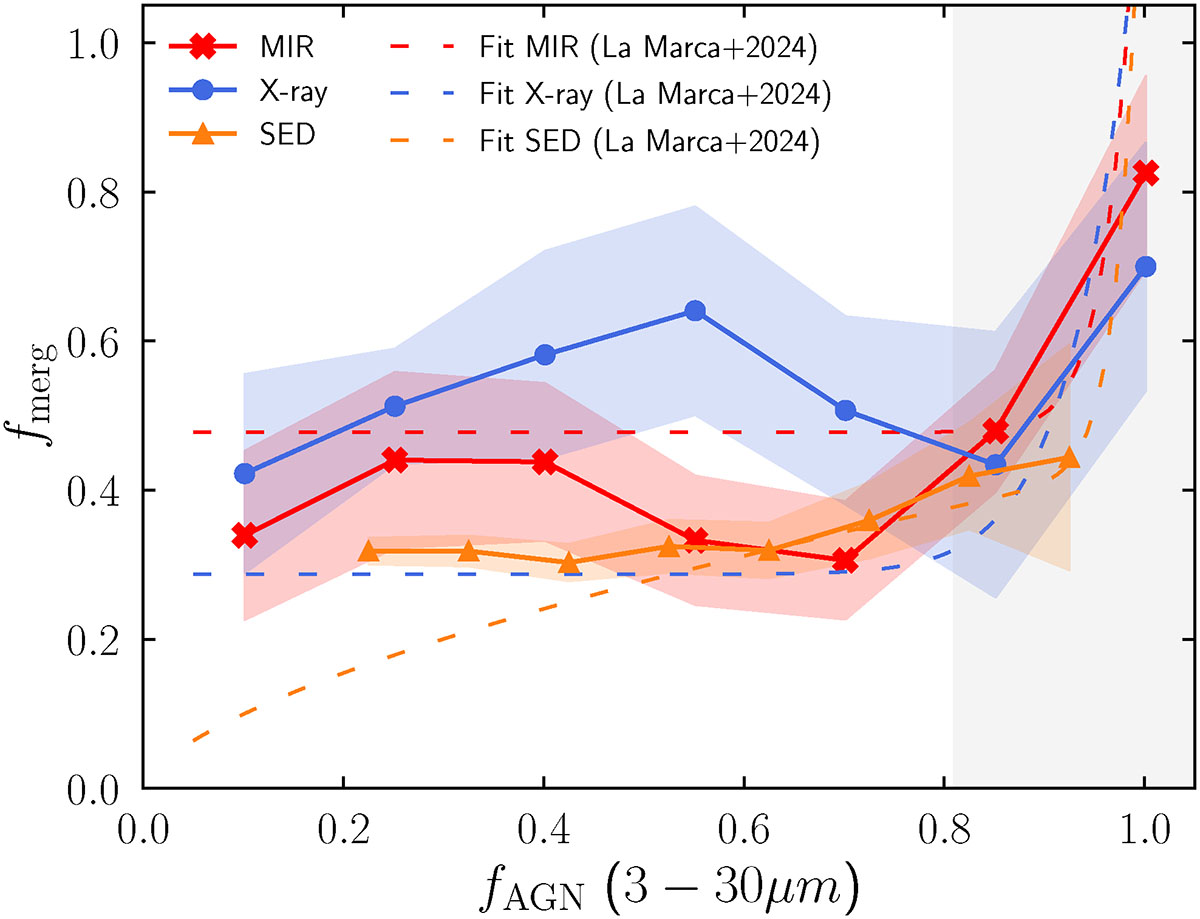
Fig. 14.
Download original image
Merger fraction as a function of AGN fraction for the MIR AGN (red crosses), X-ray AGN (blue circles), and SED AGN (orange triangles). The solid lines and coloured region show the running median and standard deviation of each relation. The dashed lines indicate the fits to the relations in LM24. The light grey area indicates the region where the relationships’ behaviours change strongly (see text).
Current usage metrics show cumulative count of Article Views (full-text article views including HTML views, PDF and ePub downloads, according to the available data) and Abstracts Views on Vision4Press platform.
Data correspond to usage on the plateform after 2015. The current usage metrics is available 48-96 hours after online publication and is updated daily on week days.
Initial download of the metrics may take a while.