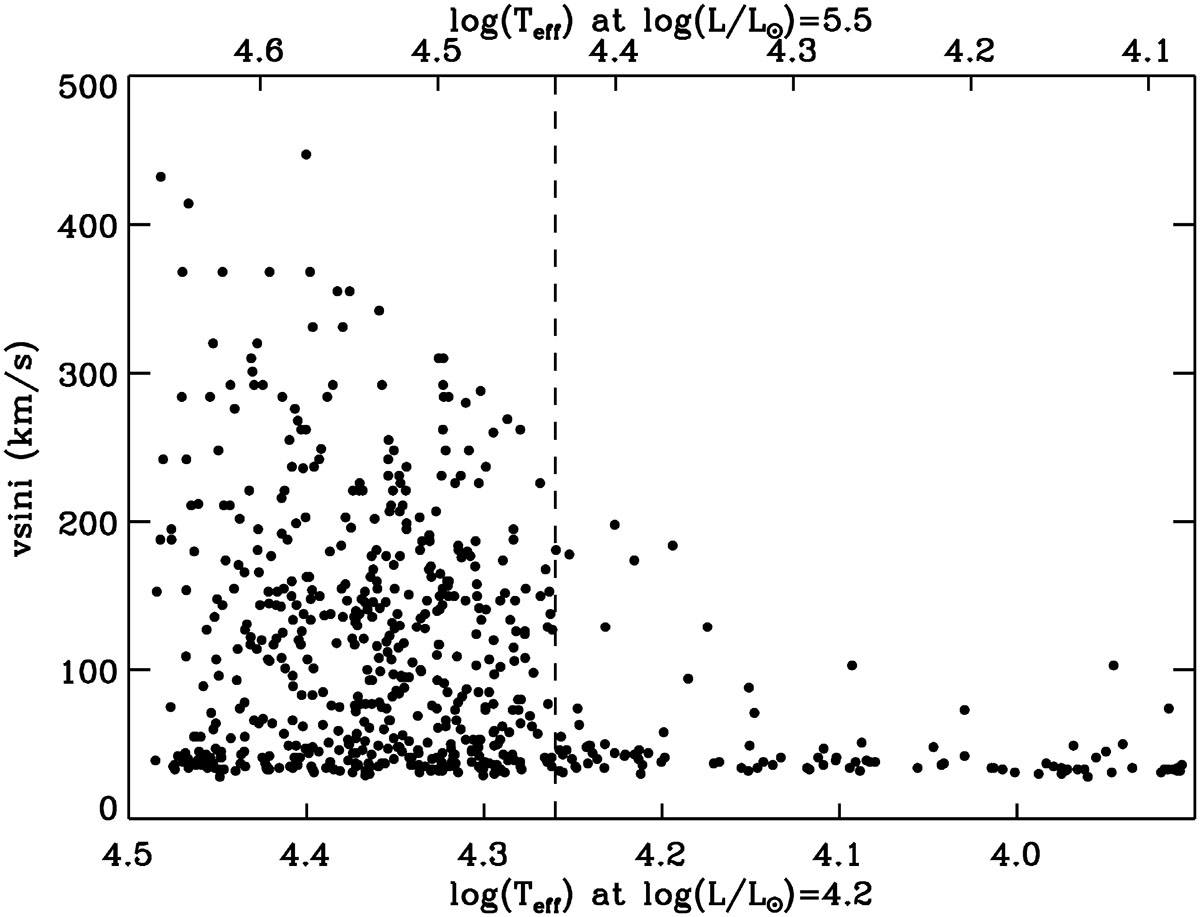
Fig. 8.
Download original image
Distribution of v sin i as a function of distance from the ZAMS as indicated by Teff as defined by the lower and upper luminosity boundaries illustrated in Fig. 7. The vertical dashed line indicates the TAMS at these luminosities as defined by the approximate position of the decrease in the v sin i distribution.
Current usage metrics show cumulative count of Article Views (full-text article views including HTML views, PDF and ePub downloads, according to the available data) and Abstracts Views on Vision4Press platform.
Data correspond to usage on the plateform after 2015. The current usage metrics is available 48-96 hours after online publication and is updated daily on week days.
Initial download of the metrics may take a while.