Fig. 5.
Download original image
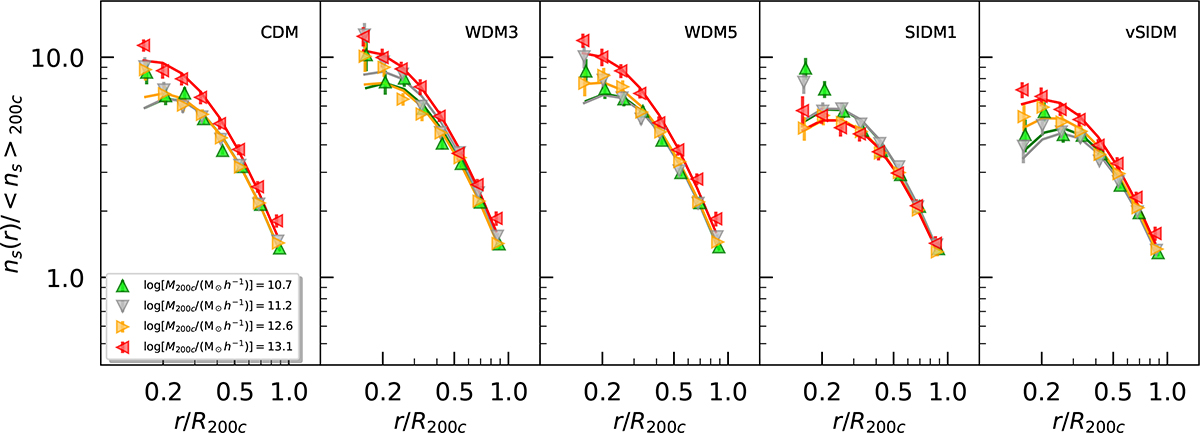
From left to right: Radial distribution of dark matter subhalos at z = 0 for various mass bins and dark matter models. The triangles represent bins with a group mass of log[M200c/(M⊙ h−1)] = 10.7 (green), 11.2 (gray), 12.6 (gold), and 13.1 (red), respectively. The solid, colored lines reflect the gNFW best-fit model. The corresponding errors are computed with the standard deviation of the measurements, for each mass bin.
Current usage metrics show cumulative count of Article Views (full-text article views including HTML views, PDF and ePub downloads, according to the available data) and Abstracts Views on Vision4Press platform.
Data correspond to usage on the plateform after 2015. The current usage metrics is available 48-96 hours after online publication and is updated daily on week days.
Initial download of the metrics may take a while.