| Issue |
A&A
Volume 706, February 2026
|
|
|---|---|---|
| Article Number | L4 | |
| Number of page(s) | 9 | |
| Section | Letters to the Editor | |
| DOI | https://doi.org/10.1051/0004-6361/202557939 | |
| Published online | 27 January 2026 | |
Letter to the Editor
Identification of solid N2O in interstellar ices using open JWST data
Research Laboratory for Astrochemistry, Ural Federal University Kuibysheva St. 48 Yekaterinburg 620026, Russia
★ Corresponding author: This email address is being protected from spambots. You need JavaScript enabled to view it.
Received:
2
November
2025
Accepted:
3
January
2026
Abstract
Context. Only six molecules containing an N-O bond are detected in the gaseous phase of the interstellar medium. One of them is nitrous oxide (N2O), which was unsuccessfully searched for in solid form since the launch of the Infrared Space Observatory (ISO) mission. The observational capabilities of the James Webb Space Telescope (JWST) present the possibility of identifying solid interstellar N2O.
Aims. We aim to identify nitrous oxide in open JWST spectra of interstellar ices toward a sample of Class 0, 0/I, and flat protostars using the relevant laboratory mixtures of N2O-bearing interstellar ice analogs.
Methods. A set of laboratory infrared transmission spectra was obtained for the following mixtures: N2O:CO2 = 1:20, N2O:CO = 1:20, N2O:N2 = 1:20, N2O:CO2:CO = 1:15:5, and N2O:CO2:N2 = 1:15:13 at 10–23 K. A search for N2O in JWST NIRSpec spectra toward 50 protostars was performed by fitting the 4.44–4.47 μm (2250–2235 cm−1) NN-stretch absorption band with new laboratory mixtures of N2O-bearing ices.
Results. We claim the first secure identification of N2O in 16 protostars. The fitting results show that N2O is formed predominantly within the apolar layer of the ice mantles, which are rich in CO, CO2, and N2. The abundance of solid N2O is estimated at 0.2–2.1% relative to solid CO. We present the band strengths for N2O in the mixtures corresponding to the apolar layer. We also report the identification of the C-N stretch band at 4.42 μm (2260 cm−1), which we tentatively assign to HNCO, the simplest C-N bond carrier.
Key words: astrochemistry / molecular data / methods: laboratory: molecular / stars: protostars / ISM: abundances / ISM: molecules
Publisher note: The shift of the columns in the second row of Table C.1 header was corrected on 17 February 2026.
© The Authors 2026
 Open Access article, published by EDP Sciences, under the terms of the Creative Commons Attribution License (https://creativecommons.org/licenses/by/4.0), which permits unrestricted use, distribution, and reproduction in any medium, provided the original work is properly cited.
This article is published in open access under the Subscribe to Open model. This email address is being protected from spambots. You need JavaScript enabled to view it. to support open access publication.
1. Introduction
Nitrous oxide (N2O) is one of the six N–O bond molecules that are detected in the gaseous phase (McGuire 2022). They are important for the evolution of the molecular complexity in space. While it was detected in the gaseous phase in various astronomical environments, namely, in the Sgr B2 interstellar cloud (Ziurys et al. 1994; Halfen et al. 2001), in the protostellar binary IRAS 16293-2422 (Ligterink et al. 2018), in the G+0.693 molecular cloud (Rivilla et al. 2020), and in the atmosphere of Mars (Villanueva et al. 2013), its solid-state counterpart, which might be a tracer of nitrogen chemistry in icy grain mantles, remains elusive. The detection of solid N2O may serve as a tracer in the formation of more complex nitrogen-bearing molecules (Fedoseev et al. 2018) and might act as a proxy for the presence and chemical activity of infrared-inactive molecules (N2 and O2) in ices (e.g. Elsila et al. 1997; Jamieson et al. 2005; Pereira et al. 2018). Nitrous oxide might provide a direct abiotic route to species of prebiotic relevance (Jamieson et al. 2005), and it was itself recently proposed as a potential biosignature (Schwieterman et al. 2022).
The search for solid N2O in interstellar ices has been conducted for decades. Initial investigations with the Infrared Space Observatory (ISO) yielded negative results (Ehrenfreund et al. 1997), which highlights that it is hard to identify. Laboratory studies, however, showed that N2O may be produced by UV irradiation of apolar ices (Elsila et al. 1997; Moore & Hudson 2003). More recent experimental works also suggested that N2O might be a component of cold interstellar ices and might form efficiently through ion bombardment (e.g. Jamieson et al. 2005; Sicilia et al. 2012; Pereira et al. 2018) of apolar N2-containing ices. This makes it a promising candidate for future observations.
N2O can also be formed after ion bombardment of nitrous oxides, as shown in experiments with NO2:N2O4 mixture at 16 K and 60 K (Fulvio et al. 2019). Finally, modeling predicts N2O to be the most abundant of the nitrous oxides (NxOy) that form under the ion bombardment of N2-containing ices (Queiroz et al. 2025).
The unprecedented quality of the James Webb Space Telescope (JWST) data reignited the search for N2O. Recent studies reported tentative detections in the 4.4–4.52 μm (2272–2212 cm−1) region (Nazari et al. 2024) based on the spectrum of pure crystalline N2O at 70 K and in the 7.7 μm band toward the Ced 110 IRS4A protostar, where a spectrum of pure irradiated N2O was used (Rocha et al. 2025). This provided the first N2O column density estimate: 8.1 × 1016 cm−2 (1.8% relative to solid H2O). The analysis of IRAS 23385+6053 also suggested a tentative assignment of a feature in the 7.7 μm region to N2O (Nakibov et al. 2025) based on underfitting in this region.
However, using the laboratory spectra of pure or irradiated N2O is unreliable because interstellar ices have complex chemical composition. N2O is expected to be a trace component that is likely embedded in CO/CO2-rich (apolar) environments. Moreover, the infrared-band profiles and peak positions of solid species are known to shift significantly depending on the molecular environment. Currently, the following N2O infrared (IR) laboratory transmission spectra are available: pure N2O in the range of 10–70 K (Hudson et al. 2017; Gerakines & Hudson 2020), pure N2O at 16 K (Fulvio et al. 2009), N2O:H2O = 1:29 at 14 K (Bergantini et al. 2022), and N2O:CO2 = 1:2 at 11 K (Pereira et al. 2018). Because the high-quality observational JWST data are available the lack of relevant reference data becomes a primary obstacle to a secure identification. The feature in the range of 2250–2235 cm−1 in the open JWST data that we explored is a candidate for a solid interstellar N2O assignment based on the NN stretching mode. This region likely contains the absorption band of the N2O in the apolar environment (e.g. CO2, CO, and N2) because laboratory mixtures of N2O in the polar layer do not match this range (see e.g. Bergantini et al. 2022). Several studies supported the origin of N2O in apolar N2-bearing ices: CO:N2, N2:O2:CO, N2:O2:CO2:CO (Elsila et al. 1997), CO:N2 (Moore & Hudson 2003), N2:CO2 (Jamieson et al. 2005), CO:N2 (Sicilia et al. 2012), and N2:O2 (Lo et al. 2018).
We present the first reliable identification of solid N2O in interstellar ices. We achieved this by combining the unparalleled sensitivity and resolution of JWST with a dedicated laboratory study of N2O in the apolar environment. Our survey of 50 protostars of variable classes and masses available in the Mikulski Archive for Space Telescopes1 (MAST) database revealed clear spectroscopic signatures of N2O in 16 sources, which allowed us to derive its column density and establish first observational constraints on its environment in interstellar ice.
2. Experimental setup and methods
The transmission laboratory spectra we used for N2O identification were obtained using the Ice Spectroscopy Experimental Aggregate (ISEAge), a cryogenic ultra-high vacuum setup described in detail in Ozhiganov et al. (2024). Briefly, the ISEAge setup allows us to produce and study interstellar ice analogs. The base pressure in the chamber prior to experiments is 2 × 10⁻¹⁰ mbar, and the temperature of the Ge substrate can be set and held within 6.7–305 K range. The transmission laboratory IR spectra were obtained with the Thermo Scientific Nicolet iS50 FTIR spectrometer operated within a 4000–630 cm−1 (2.5–15.9 μm) range with 1 cm−1 resolution. The ices were deposited via the background deposition technique (Accolla et al. 2011; Fedoseev et al. 2015; Rachid et al. 2021, 2022; Kruczkiewicz et al. 2024; Satorre et al. 2025). The individual deposition rates were calibrated using Stanford Research Systems RGA200 quadruple mass spectrometer (QMS) in combination with IR spectroscopy via the calibration curves, which we obtained following Slavicinska et al. (2023).
The ices were grown on a Ge substrate cooled down to 10 ± 0.1 K. The N2O deposition rate was calibrated using the band strength of 5.891 × 10⁻¹⁷ cm for the ν3 mode at 10 K taken from Hudson et al. (2017). In all the experiments, pure N2O was introduced into the main UHV chamber at the desired fixed deposition rate through the first leak valve. Simultaneously, second gas or a precalibrated gas mixture was introduced into the main chamber through the second independent leak valve. The QMS signal is continuously monitored during the depositions to ensure that the deposition rate was consistent with the calibration curve values. The compositions of the deposited ice mixtures were verified by examining the features in IR spectra. Co-depositions continued for 120 minutes, and the N2O deposition rate was fixed at 2.95 × 1012 cm−2 s−1. This resulted in a total N2O column density of 2 × 1016 cm−2. The ice was then warmed up at a rate of 0.5 K per minute. During the warm-up, the IR laboratory spectra were recorded every 45 seconds (averaging over 32 scans). We present the transmission laboratory spectra of N2O absorption in the apolar environment at 10 K and 23 K for the first time: N2O:CO2 = 1:20, N2O:CO = 1:20, N2O:N2 = 1:20, N2O:CO2:CO = 1:15:5, and N2O:CO2:N2 = 1:15:13. The N2O absorption bands were isolated via baseline correction for further use.
The compounds we used are N2O (99.999%, BK-Grypp), CO (99.9999%, Ugra-PGS), CO2 (99.9999%, Ugra-PGS), and N2 (99.9999%, Ugra-PGS). Gaseous N2O, CO, CO2, and N2 were introduced directly into the dosing lines from the commercially acquired gas bottles.
3. Observations and fitting procedure
We focused on detecting N2O by its most prominent ν3 absorption band at ∼4.45 μm. The 7.77 μm band (ν1) is about four times less intense and was not analyzed because the signal-to-noise ratio in this region was too low.
We surveyed the MAST database for protostars observed with JWST Near-Infrared Spectrometer (NIRSpec) and compiled an initial list of 50 sources (MAST DOI: 10.17909/tg2a-kv41). NIRspec uses G395M/G395H modes with the spectral resolution of ∼1000 and ∼2700, respectively, and covers the range of 2.87–5.27 μm. We used science data with the level 3 pipeline calibration (calibration pipeline described by Greenfield & Miller 2016; Bushouse et al. 2024; van Gelder et al. 2024). We manually examined each source and searched for the apertures with detectable N2O features based on our laboratory reference spectra. The search was challenging because the gaseous CO emission lines overlap with the region of interest, and therefore, we classified the sources into three groups:
-
+
Sources in which we were able to identify an aperture with N2O features that had none or weak overlap with CO emission.
-
+
Sources in which we were able to identify an aperture with N2O features that overlapped the CO emission, but the emission could be masked without causing severe distortions to the spectrum.
-
–
Sources in which we were not able to identify an aperture with N2O features due to strong CO emission and/or a low signal-to-noise ratio.
The search yielded 16 sources (MAST DOI: 10.17909/sg05-m334) in which we selected the apertures with minimal distortions in the N2O region with the aim of a secure detection claim. In four objects, we recovered the N2O feature from gaseous CO lines. For these sources, we provide an additional aperture with a clear N2O feature. The intensity maps and chosen apertures are presented in Appendix A. The aperture parameters are presented in Table C.1.
We then prepared the laboratory spectra for the fitting procedure by subtracting the continuum and converting them into the optical depth. If required, we masked the gaseous CO emission lines. The details are presented in Appendix B. In some of the laboratory spectra, the N2O feature overlaps a feature in 2280–2250 cm−1 (4.39–4.44 μm) region that is commonly associated with the CN-stretch band, for instance, isocyanic acid (HNCO) and acetonitrile (CH3CN). The CN-stretch region also contained a gaseous emission doublet (H2, Nazari et al. 2024) that lies in the range of 2270–2265 cm−1, which hindered the identification of the exact carrier. We therefore tentatively assigned it to HNCO because it is the simplest CN-bearing molecule in this spectral region. A Gaussian function was included in the fit to cover the 2280–2250 cm−1 feature, which resolved the overlapped bands. We also fit Gaussian functions to estimate the column densities of CO, 13CO2, and OCN−. The 12CO2 absorption band was not analyzed because it was saturated in the observational data. We also note that the profile of the intense solid CO feature at 4.67 μm toward protostars can be affected by grain shape effects (see, e.g. Pontoppidan et al. 2003, and references therein). This issue is not explored in this Letter, however.
The fitting was performed in two stages. For the first stage, we used the laboratory spectra of N2O in the apolar environment: mixtures with CO, CO2, and N2 (see Fig. 1). The objects in our study are protostars, which are likely to have a temperature gradient in their inner regions. We, however, lack detailed constraints on the physical structure of these sources. The observational spectra show a strong solid CO absorption feature at 4.67 μm. The N-bearing ices we investigated also have relatively low sublimation temperatures. Finally, laboratory experiments proved the possibility of N2O formation in N2-containing ices at low temperatures (e.g., Fedoseev et al. 2018). We therefore assumed that the fitted spectral features originate from cold ices residing in cold protostar envelopes. Consequently, we use laboratory ice spectra obtained at temperatures below the sublimation point of N2 (23 K) to analyze the observations. Each ice mixture spectrum is available at 35 discrete temperature points, spaced at even intervals of ∼0.4 K. For each source, we performed a fit at each of these 35 temperatures Ti by modeling the observed spectral feature with a linear combination of laboratory spectra of different mixtures (all taken at that same Ti) plus an HNCO Gaussian function, minimizing χ2,
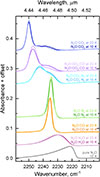 |
Fig. 1. ν3 mode of N2O in pure N2O, N2O:H2O = 1:20 and nitrous oxide in astrochemically relevant matrices corresponding to the apolar layer of ice mantles N2O:CO = 1:20, N2O:N2 = 1:20, N2O:CO2:N2 = 1:15:13, N2O:CO2:CO = 1:15:5, and N2O:CO2 = 1:20. The spectra are displayed for the lowest and highest temperatures we considered. |
 (1)
(1)
where τobs is the optical depth of the observational spectrum, and τlab(Ti) is the optical depth of a fitted linear combination of the laboratory spectra and the HNCO Gaussian at 2280–2250 cm−1. Ti is the temperature of the fitted combination, Nobs is a number of points in the fitted segment of the observational spectrum, and σj is the point-wise standard deviation of the observational spectrum. A sliding-window smoothed curve (12–16 points, locally estimated weighted scatterplot smoothing, Cleveland 1979) was subtracted from the original optical depth spectrum to estimate σi from the residuals. From these 35 fits in the 10–23 K range, we then selected the overall best-fit spectrum for each source. Following Avni (1976), the error of the temperature estimates was obtained from the χ2(Ti) line with Δχ2 = 1 (α = 68%). The column density errors were estimated as the best-fit uncertainty. The band strengths of N2O in mixtures were estimated from band area measurements based on the value from Hudson et al. (2017, see the band strengths in our Table C.2).
In the second stage, the fitted spectrum was subtracted from the observational spectrum because the Gaussian in the 2280–2250 cm−1 region overlaps the 13CO2 feature. Then, three Gaussian functions were fit to the residual spectrum to estimate the column densities of CO, OCN− and 13CO2. As in the first stage, the column density errors were estimated as the best-fit uncertainty.
4. Results and discussion
In Fig. 1 we present the new laboratory IR transmission spectra of N2O-bearing mixtures in the apolar environment along with a pure N2O and N2O:H2O mixture at 10 K and 23 K. The spectra obtained at intermediate temperatures are not shown because the shapes of the N2O features vary smoothly in the 10–23 K range. The blueshift of the 4.45 μm (ν3) feature with respect to its position in the spectrum of the pure N2O is higher in the apolar environment than in N2O:H2O mixture. The highest blueshift of 28 cm−1 relative to pure N2O is observed for the N2O:CO2 = 1:20 mixture. Ternary mixtures with CO2 and CO/N2 produce a broad N2O feature that is limited by the peak positions observed for binary mixtures with CO2 and CO/N2 at a ratio of 1:20. The structure of the N2O feature in ternary mixtures clearly indicates the presence of CO/N2- and CO2-associated components. This shows that the position and shape of the feature are sensitive to the ice composition. In summary, the N2O absorption band in the apolar environment spans the range of about 2250–2235 cm−1, and its line shape depends on the composition.
In Fig. D.1 the observed spectra of N2O-related feature for 20 apertures in 16 protostars are shown along with the best-fit results. The comparison with Fig. 1 shows that the spectral feature of the N2O:H2O mixture positioned at 2230 cm−1 falls outside the observed features. All derived temperatures and column densities are listed in Table C.1. In all observed sources, the JWST spectra were fit with the ice mixtures corresponding to the apolar layer of the ice mantles. The derived N2O column densities relative to solid CO are in the range of 0.2–2.1%. Assuming a typical CO abundance relative to H2O in a range of 10–30%, we estimated the N2O abundance with respect to H2O to be in the range of 0.02–0.84%. The 2280–2250 cm−1 band was tentatively assigned to the C-N stretch absorption band of HNCO. It is the simplest CN-stretch mode carrier, which commonly appears with N2O in the irradiation experiments (see e.g. Fedoseev et al. 2018). Because of the H2 emission in 2270–2265 cm−1 range, we constrained the HNCO peak position to 2260 ± 2 cm−1, which agrees with the 2260 cm−1 HNCO feature reported by Fedoseev et al. (2018). We note that CH3CN or C2H5CN are other possible candidates for this region (Nazari et al. 2024). The column densities obtained in this work for 13CO2, OCN− agree with values that were previously published in literature (see Appendix C for more details).
The detection of N2O in the apolar layer agrees with the laboratory studies of the irradiation of N2-bearing ices (e.g. Elsila et al. 1997; Lo et al. 2018). There are observational and chemical reasons for the nondetection of N2O in the ∼2230 cm−1 region, which corresponds to N2O embedded in H2O. In observational data for this region, the gaseous CO interference is stronger, which lowers the quality of the data and complicates the data selection. The chemical reason is the limited availability of N2O key precursor, N2, in H2O-dominated ices (Hudson 2018). Interestingly, 8 of the 16 sources from the sample are the so-called HOPS sources in Orion A. Notably, this region is a subject to high UV background irradiation (Peeters et al. 2024), which further supports the irradiation-driven pathways of N2O formation in interstellar ices.
Acknowledgments
This work is based on observations made with the NASA/ESA/CSA James Webb Space Telescope. The data were obtained from the Mikulski Archive for Space Telescopes at the Space Telescope Science Institute, which is operated by the Association of Universities for Research in Astronomy, Inc., under NASA contract NAS 5-03127 for JWST. We would like to thank Gleb Fedoseev and Vadim Krushinsky for assembling, calibrating and launching the ISEAge setup, and to Olga Russkikh for helpful discussions during manuscript revision. We thank the anonymous reviewer for their insightful comments that helped us to improve the manuscript and the language editor Astrid Peter for English corrections. This research work is funded by the Russian Science Foundation via 23-12-00315 agreement.
References
- Accolla, M., Congiu, E., Dulieu, F., et al. 2011, PCCP, 13, 8037 [Google Scholar]
- Avni, Y. 1976, ApJ, 210, 642 [NASA ADS] [CrossRef] [Google Scholar]
- Bergantini, A., de Barros, A. L. F., Toribio, N. N., et al. 2022, JPCA, 126, 2007 [Google Scholar]
- Bouilloud, M., Fray, N., Bénilan, Y., et al. 2015, MNRAS, 451, 2145 [Google Scholar]
- Brunken, N. G. C., van Dishoeck, E. F., Slavicinska, K., et al. 2024, A&A, 692, A163 [NASA ADS] [CrossRef] [EDP Sciences] [Google Scholar]
- Brunken, N. G. C., Boogert, A. C. A., van Dishoeck, E. F., et al. 2025, ESC, 9, 1992 [Google Scholar]
- Bushouse, H., Eisenhamer, J., Dencheva, N., et al. 2024, https://doi.org/10.5281/zenodo.10870758 [Google Scholar]
- Chen, H.-R. V., Keto, E., Zhang, Q., et al. 2016, ApJ, 823, 125 [NASA ADS] [CrossRef] [Google Scholar]
- Cleveland, W. S. 1979, JASA, 74, 829 [Google Scholar]
- Ehrenfreund, P., d’Hendecourt, L., Dartois, E., et al. 1997, Icarus, 130, 1 [Google Scholar]
- Elsila, J., Allamandola, L. J., & Sandford, S. A. 1997, ApJ, 479, 818 [NASA ADS] [CrossRef] [Google Scholar]
- Fedoseev, G., Ioppolo, S., Zhao, D., Lamberts, T., & Linnartz, H. 2015, MNRAS, 446, 439 [NASA ADS] [CrossRef] [Google Scholar]
- Fedoseev, G., Scirè, C., Baratta, G. A., & Palumbo, M. E. 2018, MNRAS, 475, 1819 [Google Scholar]
- Fulvio, D., Sivaraman, B., Baratta, G. A., Palumbo, M. E., & Mason, N. J. 2009, AcSpA, 72, 1007 [Google Scholar]
- Fulvio, D., Baratta, G. A., Sivaraman, B., et al. 2019, MNRAS, 483, 381 [Google Scholar]
- Furlan, E., Fischer, W. J., Ali, B., et al. 2016, ApJS, 224, 5 [Google Scholar]
- Gerakines, P. A., & Hudson, R. L. 2020, ApJ, 901, 52 [NASA ADS] [CrossRef] [Google Scholar]
- Gerakines, P. A., Materese, C. K., & Hudson, R. L. 2025, MNRAS, 537, 2918 [Google Scholar]
- Greenfield, P., & Miller, T. 2016, A&C, 16, 41 [Google Scholar]
- Halfen, D., Apponi, A., & Ziurys, L. 2001, ApJ, 561, 244 [NASA ADS] [CrossRef] [Google Scholar]
- Hudson, R. L. 2018, ApJ, 867, 160 [Google Scholar]
- Hudson, R., Loeffler, M., & Gerakines, P. 2017, JChPh, 146, 024304 [Google Scholar]
- Jamieson, C. S., Bennett, C. J., Mebel, A. M., & Kaiser, R. I. 2005, ApJ, 624, 436 [Google Scholar]
- Kruczkiewicz, F., Dulieu, F., Ivlev, A. V., et al. 2024, A&A, 686, A236 [NASA ADS] [CrossRef] [EDP Sciences] [Google Scholar]
- Launhardt, R., Stutz, A. M., Schmiedeke, A., et al. 2013, A&A, 551, A98 [NASA ADS] [CrossRef] [EDP Sciences] [Google Scholar]
- Ligterink, N. F. W., Calcutt, H., Coutens, A., et al. 2018, A&A, 619, A28 [NASA ADS] [CrossRef] [EDP Sciences] [Google Scholar]
- Lo, J.-I., Chou, S.-L., Peng, Y.-C., et al. 2018, ApJ, 864, 95 [Google Scholar]
- McGuire, B. A. 2022, ApJS, 259, 30 [NASA ADS] [CrossRef] [Google Scholar]
- Moore, M., & Hudson, R. 2003, Icarus, 161, 486 [NASA ADS] [CrossRef] [Google Scholar]
- Nakibov, R., Karteyeva, V., Petrashkevich, I., et al. 2025, ApJ, 978, L46 [Google Scholar]
- Nazari, P., Rocha, W., Rubinstein, A., et al. 2024, A&A, 686, A71 [NASA ADS] [CrossRef] [EDP Sciences] [Google Scholar]
- Ortiz-León, G. N., Loinard, L., Dzib, S. A., et al. 2018, ApJ, 865, 73 [Google Scholar]
- Ozhiganov, M., Medvedev, M., Karteyeva, V., et al. 2024, ApJ, 972, L10 [Google Scholar]
- Peeters, E., Habart, E., Berné, O., et al. 2024, A&A, 685, A74 [NASA ADS] [CrossRef] [EDP Sciences] [Google Scholar]
- Pereira, R., de Barros, A., Fulvio, D., et al. 2018, MNRAS, 478, 4939 [NASA ADS] [CrossRef] [Google Scholar]
- Pontoppidan, K. M., Fraser, H. J., Dartois, E., et al. 2003, A&A, 408, 981 [NASA ADS] [CrossRef] [EDP Sciences] [Google Scholar]
- Queiroz, L., Silva, J., Ferrão, L., & Pilling, S. 2025, MNRAS, 537, 3100 [Google Scholar]
- Rachid, M. G., Brunken, N., de Boe, D., et al. 2021, A&A, 653, A116 [NASA ADS] [CrossRef] [EDP Sciences] [Google Scholar]
- Rachid, M. G., Rocha, W. R. M., & Linnartz, H. 2022, A&A, 665, A89 [NASA ADS] [CrossRef] [EDP Sciences] [Google Scholar]
- Riaz, B., Martín, E. L., Bouy, H., & Tata, R. 2009, ApJ, 700, 1541 [NASA ADS] [CrossRef] [Google Scholar]
- Rivilla, V. M., Martín-Pintado, J., Jiménez-Serra, I., et al. 2020, ApJ, 899, L28 [Google Scholar]
- Rocha, W., McClure, M., Sturm, J., et al. 2025, A&A, 693, A288 [NASA ADS] [CrossRef] [EDP Sciences] [Google Scholar]
- Satorre, M. Á., Escribano, B., Santonja, C., et al. 2025, A&A, 703, A89 [NASA ADS] [CrossRef] [EDP Sciences] [Google Scholar]
- Schwieterman, E. W., Olson, S. L., Pidhorodetska, D., et al. 2022, ApJ, 937, 109 [NASA ADS] [CrossRef] [Google Scholar]
- Sicilia, D., Ioppolo, S., Vindigni, T., Baratta, G. A., & Palumbo, M. E. 2012, A&A, 543, A155 [NASA ADS] [CrossRef] [EDP Sciences] [Google Scholar]
- Slavicinska, K., Rachid, M. G., Rocha, W. R. M., et al. 2023, A&A, 677, A13 [NASA ADS] [CrossRef] [EDP Sciences] [Google Scholar]
- Smith, Z. L., Dickinson, H. J., Fraser, H. J., et al. 2025, NatAs, 9, 883 [Google Scholar]
- Tobin, J. J., Looney, L. W., Li, Z.-Y., et al. 2016, ApJ, 818, 73 [CrossRef] [Google Scholar]
- Tobin, J. J., Offner, S. S. R., Kratter, K. M., et al. 2022, ApJ, 925, 39 [NASA ADS] [CrossRef] [Google Scholar]
- van Gelder, M. L., Ressler, M. E., van Dishoeck, E. F., et al. 2024, A&A, 682, A78 [NASA ADS] [CrossRef] [EDP Sciences] [Google Scholar]
- Villanueva, G., Mumma, M., Novak, R., et al. 2013, Icarus, 223, 11 [CrossRef] [Google Scholar]
- Ziurys, L., Apponi, A., Hollis, J., & Snyder, L. 1994, ApJ, 436, L181 [NASA ADS] [CrossRef] [Google Scholar]
MAST database: https://mast.stsci.edu/portal/Mashup/Clients/Mast/Portal.html
Appendix A: Apertures
The intensity maps at 4.4 μm and selected apertures for the sources described in this Letter are displayed in Fig. A.1. Gaseous CO lines were masked in spectra extracted from the white apertures. Spectra extracted from the green apertures contained clean N2O features as is. For B1-c a ring aperture was used to avoid gaseous lines towards the center. The data on the sources and the aperture parameters are listed in Table C.1.
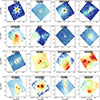 |
Fig. A.1. Intensity maps at 4.4 μm with the apertures chosen for the fit. Aperture centers and diameters are listed in Table C.1. |
Appendix B: Baselines
This section contains original and processed spectra with masked gaseous lines. The anchor points for local continuum subtraction were selected in absorption-free regions to isolate two groups of overlapping features: 13CO2, HNCO, N2O and OCN−, CO. Most of the points were chosen in the following ranges: 2325–2290 cm−1, between 12CO2 and 13CO2; 2230–2185 cm−1, between the proposed N2O and OCN− feature; 2125–2065 cm−1, next to the CO feature. In a few cases we included additional points outside these ranges to ensure the conservative estimation of local continuum and peak areas. A polynomial function, with a degree ranging from three to five, was selected to model the continuum. The spectra with the selected continua are shown in Fig. B.1.
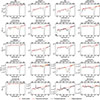 |
Fig. B.1. Raw and processed observational spectra with fitted polynomial continuum. Anchor points are represented with red dots, fitted continuum with red line. Original and processed observational spectra are shown with orange and black lines, respectively. |
Appendix C: Sources and column densities
The sources and apertures’ parameters along with the derived column densities are listed in Table C.1. In this work we estimated the column density of 13CO2 to be in the range of (1.3 – 11)×1016 cm−2. This range is consistent with 13CO2 column density range of (1.2 – 8.1)×1016 cm−2 presented in Brunken et al. (2024), 2.3×1016 cm−2 value for IRAS 20126 and 2.8×1016 cm−2 for Per-emb 35 presented in Brunken et al. (2025). Brunken et al. (2024) also presents individual column densities for B1-b, B1-c, EDJ2009-183, SER-SMM-3, PER-EMB-27 are 2.6×1016 cm−2, 7.1×1016 cm−2, 0.58 – 0.7×1016 cm−2, 2×1016 cm−2 and 5.9×1016 cm−2, respectively. These values are lower than ones derived in this work, which is explained by difference in band strengths used.
Column density values for CO obtained in this work are in (64.5 – 464)×1016 cm−2 range, consistent with, for example, 66×1016 cm−2 for Ced 110 IRS4B: (Rocha et al. 2025) and (20 – 365)×1016 cm−2 for Cha I (Smith et al. 2025). Brunken et al. (2024) also presents individual CO column densities for B1-b, B1-c, EDJ2009-183, SER-SMM-3, PER-EMB-27: 410×1016 cm−2, 500×1016 cm−2, (94 – 100)×1016 cm−2, 120×1016 cm−2 and 340×1016 cm−2, respectively. These values are similar with the ones presented in this Letter, given the difference in chosen apertures. Derived OCN− values are in range of (0.6 – 14.6)×1016 cm−2, in agreement with 2.6×1016 cm−2 for IRAS 16253, 5.0×1016 cm−2 for B335, 6.8×1016 cm−2 for HOPS 153, 16×1016 cm−2 for HOPS 370 (Nazari et al. 2024), and 9.2×1016 cm−2 for Ced 110 IRS4A (Rocha et al. 2025). To the best of our knowledge, there are currently no HNCO estimates in the literature. The band strengths for N2O at 10 K in various environments were calculated based on 10 K band strength value from Hudson et al. (2017). The values obtained are listed in the Table C.2.
Parameters of the studied objects and quantities derived from the fit.
Absorption band strength values used for the fit.
Appendix D: Fitting results
The observational spectra for the selected sample of sources, fitted N2O-bearing laboratory spectra and HNCO Gaussians are shown in Fig. D.1.
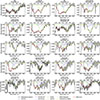 |
Fig. D.1. Observational data at 4.45 μm, fitted curves and Gaussian function for HNCO. Black line represents the observational spectra, dashed — laboratory spectra of N2O in apolar environment, short dashed — HNCO Gaussian, green — combined N2O feature, and red — full fitted curve. |
All Tables
All Figures
|
Fig. 1. ν3 mode of N2O in pure N2O, N2O:H2O = 1:20 and nitrous oxide in astrochemically relevant matrices corresponding to the apolar layer of ice mantles N2O:CO = 1:20, N2O:N2 = 1:20, N2O:CO2:N2 = 1:15:13, N2O:CO2:CO = 1:15:5, and N2O:CO2 = 1:20. The spectra are displayed for the lowest and highest temperatures we considered. |
| In the text | |
|
Fig. A.1. Intensity maps at 4.4 μm with the apertures chosen for the fit. Aperture centers and diameters are listed in Table C.1. |
| In the text | |
|
Fig. B.1. Raw and processed observational spectra with fitted polynomial continuum. Anchor points are represented with red dots, fitted continuum with red line. Original and processed observational spectra are shown with orange and black lines, respectively. |
| In the text | |
|
Fig. D.1. Observational data at 4.45 μm, fitted curves and Gaussian function for HNCO. Black line represents the observational spectra, dashed — laboratory spectra of N2O in apolar environment, short dashed — HNCO Gaussian, green — combined N2O feature, and red — full fitted curve. |
| In the text | |
Current usage metrics show cumulative count of Article Views (full-text article views including HTML views, PDF and ePub downloads, according to the available data) and Abstracts Views on Vision4Press platform.
Data correspond to usage on the plateform after 2015. The current usage metrics is available 48-96 hours after online publication and is updated daily on week days.
Initial download of the metrics may take a while.