


Fig. 3
Download original image
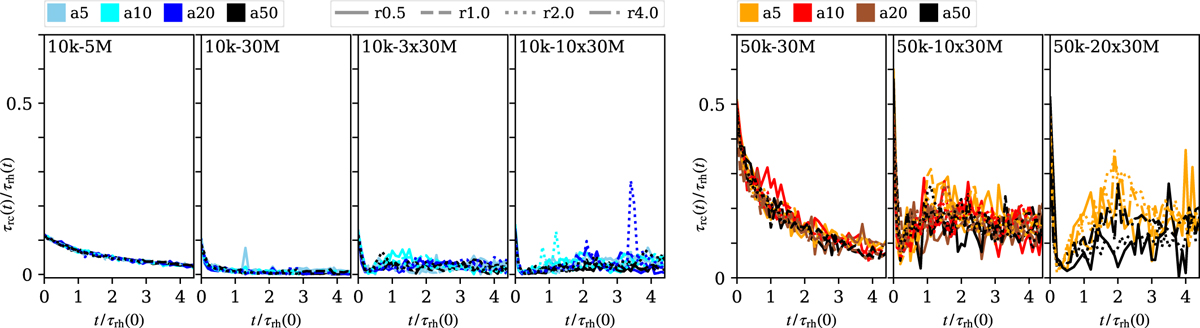
Evolution of the core relaxation time, τrc(t) in the units of τrh(t), calculated from Eq. (11). The horizontal axis shows time in terms of the initial half-mass relaxation time, τrh(0). The left-hand set of panels is for the 10k-* clusters, the right-hand set is for 50k-*. The models are separated by the primordial binary star numbers and masses (columns), the binary star initial semi-major axes (colours), and the initial cluster half-mass radius (line styles). Each line is averaged over all realisations of the corresponding model.
Current usage metrics show cumulative count of Article Views (full-text article views including HTML views, PDF and ePub downloads, according to the available data) and Abstracts Views on Vision4Press platform.
Data correspond to usage on the plateform after 2015. The current usage metrics is available 48-96 hours after online publication and is updated daily on week days.
Initial download of the metrics may take a while.