Fig. A.1
Download original image
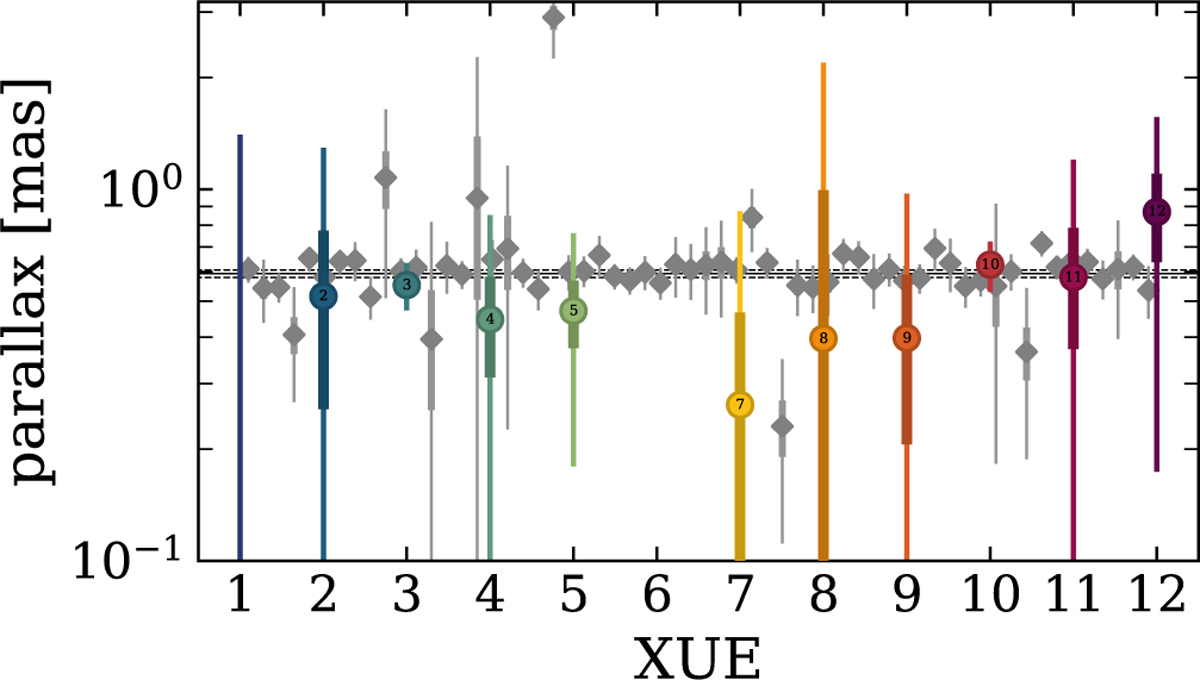
Gaia DR3 parallaxes of our sources in comparison to those of the O stars in the region (gray). The vertical thick and thin lines correspond to the 1σ and 3σ uncertainty in the parallax measurement. The horizontal black line shows the parallax at 1/1.663 mas corresponding to our determined mean distance and the dashed black lines show the parallax of the interval at [1/1.763, 1/1.563] mas.
Current usage metrics show cumulative count of Article Views (full-text article views including HTML views, PDF and ePub downloads, according to the available data) and Abstracts Views on Vision4Press platform.
Data correspond to usage on the plateform after 2015. The current usage metrics is available 48-96 hours after online publication and is updated daily on week days.
Initial download of the metrics may take a while.