Fig. B.3.
Download original image
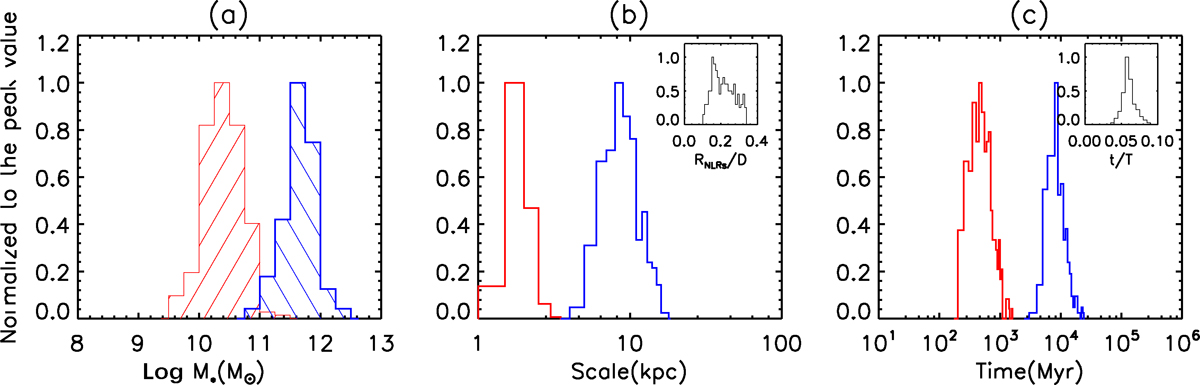
The parameter distributions for the 218 satisfied runs whose velocity parameters are consistent with SDSS J0010. Panel (a): the histograms filled in red and blue show the logarithmic total stellar mass distributions of the main and companion galaxies. Panel (b): the histograms in red and blue show the distributions of RNLRs and galaxy separation; the distribution of RNLRs/D is shown in the top right region. Panel (c): the histograms filled in red and blue show the distributions of the acceleration duration and orbital period; the distribution of the acceleration duration/orbital period is shown in the top right region.
Current usage metrics show cumulative count of Article Views (full-text article views including HTML views, PDF and ePub downloads, according to the available data) and Abstracts Views on Vision4Press platform.
Data correspond to usage on the plateform after 2015. The current usage metrics is available 48-96 hours after online publication and is updated daily on week days.
Initial download of the metrics may take a while.