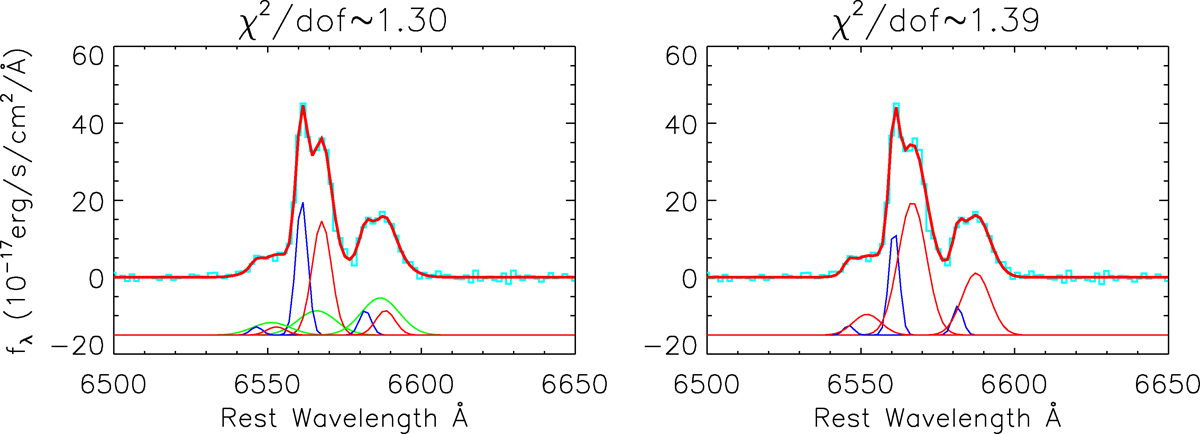
Fig. B.2.
Download original image
The best-fitting results to Hα and [N II] emission lines using three Gaussian functions (model B, left panel) to fit each narrow emission line and two Gaussian functions (model A, right panel) to fit each narrow emission line. In both panels, the cyan components represent the spectrum after subtracting the host galaxy features; the thick red components represent the best-fitting results for emission lines; the thin red and thin blue Gaussian components from left to right indicate the double-peaked features of narrow [N II]λ 6550Å, Hα, and [N II]λ 6585Å. In the left panel, the green Gaussian components indicate the extended components of [N II]λ 6550Å, Hα, and [N II]λ 6585Å. In each panel, the corresponding χ2/dof related to the best-fitting results is marked in the title.
Current usage metrics show cumulative count of Article Views (full-text article views including HTML views, PDF and ePub downloads, according to the available data) and Abstracts Views on Vision4Press platform.
Data correspond to usage on the plateform after 2015. The current usage metrics is available 48-96 hours after online publication and is updated daily on week days.
Initial download of the metrics may take a while.