Fig. 4.
Download original image
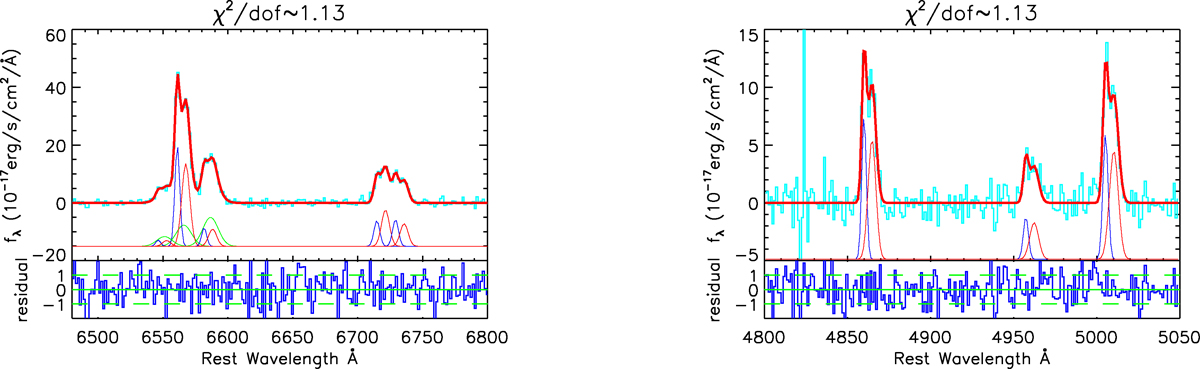
Spectroscopic results of SDSS J001050.52−103246.6. Left and right panels present the best-fitting results to the emission lines around Hα and Hβ, respectively. In both panels, the cyan components indicate the spectrum after subtracting the host galaxy starlight; the thick red components indicate the best-fitting results; and the solid lines in the bottom region of each panel indicate residuals. In the left panel, the thin red and thin blue Gaussian components from left to right indicate the double-peaked features of narrow [N II]λ6550 Å, Hα, [N II]λ6585 Å, [S II]λ6718 Å, and [S II]λ6732 Å; the green Gaussian components indicate the extended emission components in [N II]λ6550 Å, Hα, and [N II]λ6585 Å. In the right panel, the thin red and thin blue Gaussian components from left to right indicate the double-peaked features of narrow Hβ, [O III]λ4959 Å, and [O III]λ5007 Å. In each panel, the corresponding χ2/d.o.f. related to the best-fitting results is marked in the title.
Current usage metrics show cumulative count of Article Views (full-text article views including HTML views, PDF and ePub downloads, according to the available data) and Abstracts Views on Vision4Press platform.
Data correspond to usage on the plateform after 2015. The current usage metrics is available 48-96 hours after online publication and is updated daily on week days.
Initial download of the metrics may take a while.