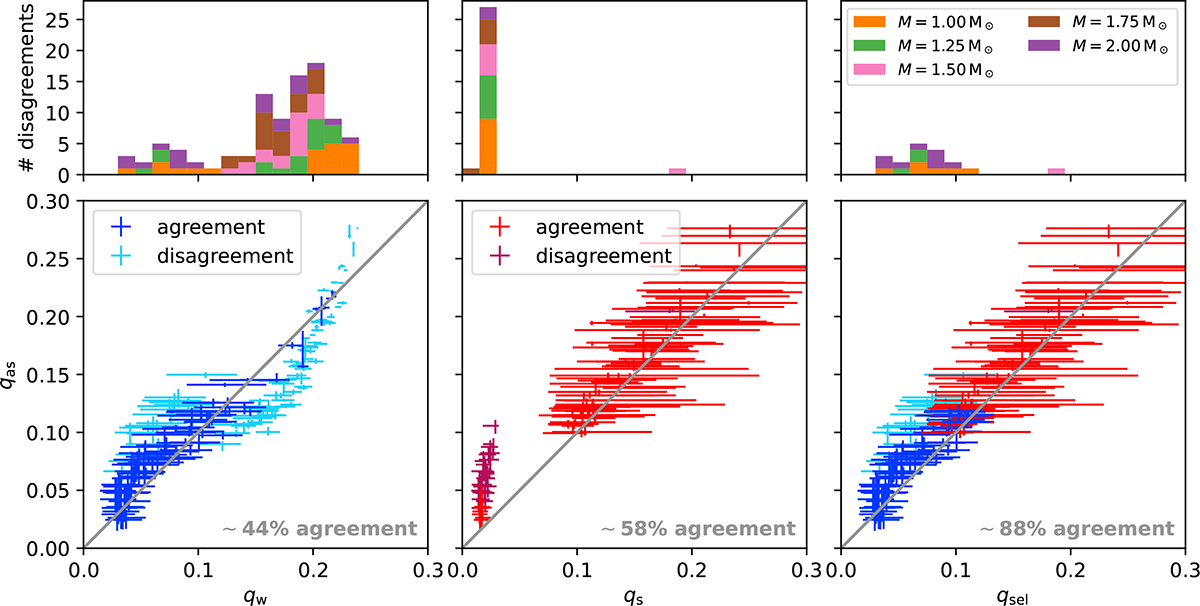
Fig. 8.
Download original image
Comparison of the coupling strengths obtained via asymptotic fitting and theoretical calculations. From left to right, the theoretical prescription used is the weak coupling, strong coupling, and the selection of one of the two as given by Eq. (23). Bottom row: qas (with uncertainties as described in Sect. 3.3) on the y-axis vs. theoretical values (the error bars indicate the range across the fitted frequencies) on the x-axis. Models that agree with the one-to-one line (gray diagonal) within the error bars are shown in dark blue resp. red for qw resp. qs, and those that disagree are shown in light blue resp. purple. Percentages relative to the total number of models we fit. Top row: histograms of the distribution of disagreeing models over the theoretical coupling values. The stacked-up colors represent models of different masses as indicated in the legend.
Current usage metrics show cumulative count of Article Views (full-text article views including HTML views, PDF and ePub downloads, according to the available data) and Abstracts Views on Vision4Press platform.
Data correspond to usage on the plateform after 2015. The current usage metrics is available 48-96 hours after online publication and is updated daily on week days.
Initial download of the metrics may take a while.