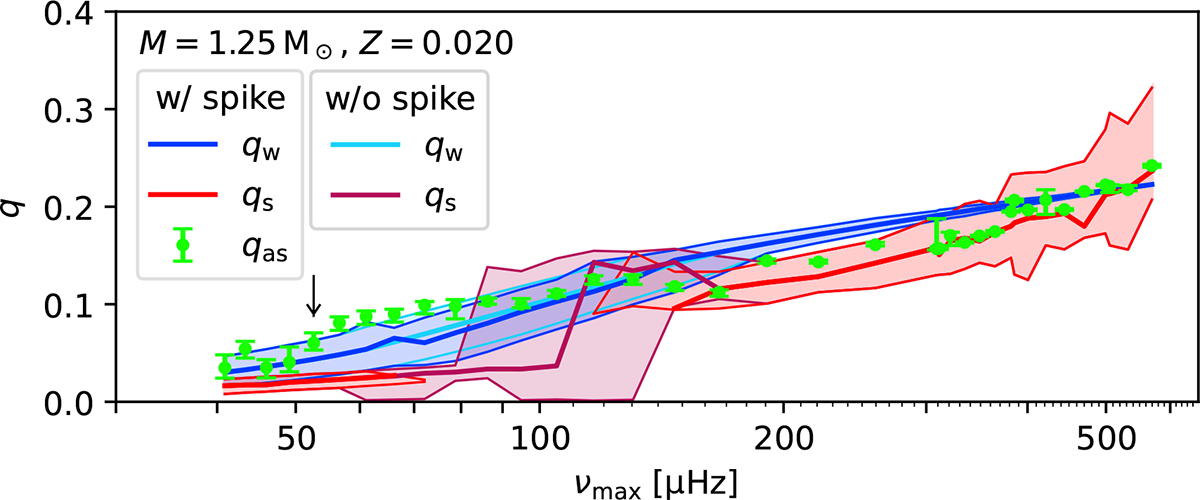
Fig. 4.
Download original image
Values of the coupling strength q computed in the three ways presented in Sect. 3 as a function of νmax for stellar models with M = 1.25 M⊙, Z = 0.020 along the RGB. The star evolves from right to left. The solid lines represent qw(νmax) (dark blue for the full profile, and light blue for profile without the N2 spike) and qs(νmax) (red for the full profile, and purple without the spike), and the shaded areas show the range of values we calculated for the frequencies in the sample used for the fit. The green markers show qas with the uncertainties as described in Sect. 3.3. Below 100 μHz, the x-axis ticks show spacings of 10 μHz; above 100 μHz, the major ticks show spacings of 100 μHz and the minor ticks continue in steps of 10 μHz. The arrow indicates the model that is further analyzed in Fig. 10.
Current usage metrics show cumulative count of Article Views (full-text article views including HTML views, PDF and ePub downloads, according to the available data) and Abstracts Views on Vision4Press platform.
Data correspond to usage on the plateform after 2015. The current usage metrics is available 48-96 hours after online publication and is updated daily on week days.
Initial download of the metrics may take a while.