Fig. 10.
Download original image
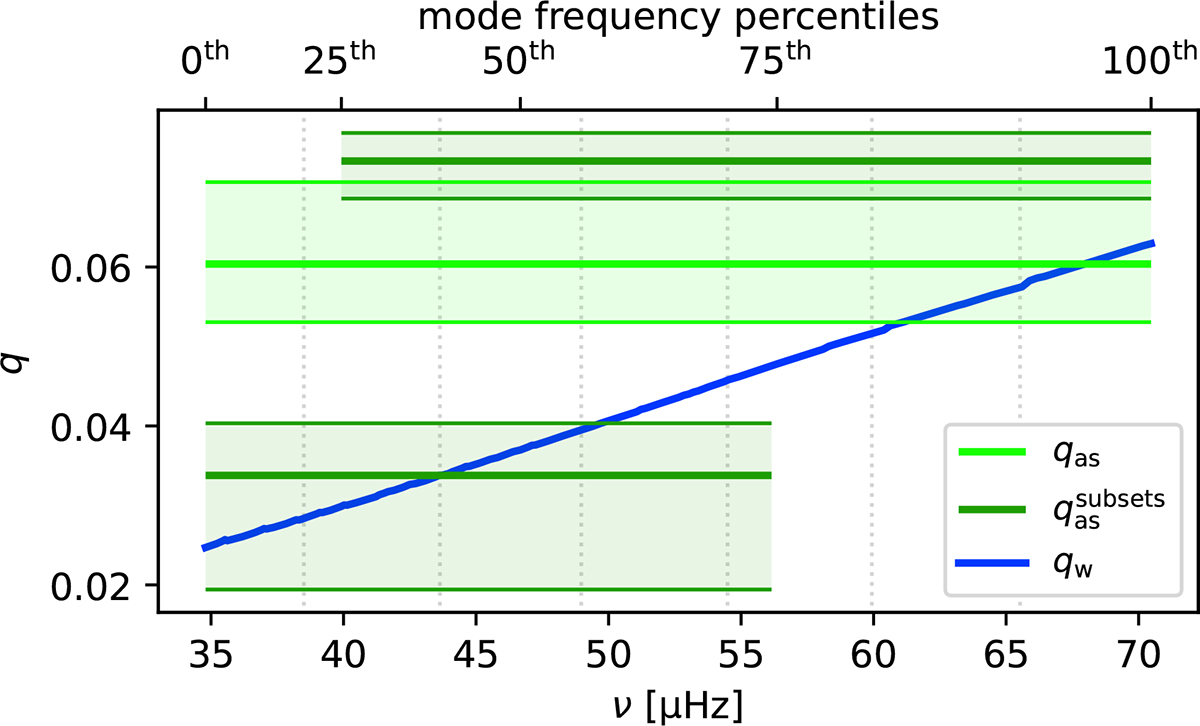
Coupling strength for the model marked with an arrow in Fig. 4 as a function of mode frequency. The fit values qas were fit to modes in the frequency range indicated by the width of the marker, and the uncertainties were estimated as described in Sect. 3.3. The solid dark blue line shows the weak coupling calculated as per Eq. (12). The vertical dotted lines indicate the frequencies of the model’s radial modes.
Current usage metrics show cumulative count of Article Views (full-text article views including HTML views, PDF and ePub downloads, according to the available data) and Abstracts Views on Vision4Press platform.
Data correspond to usage on the plateform after 2015. The current usage metrics is available 48-96 hours after online publication and is updated daily on week days.
Initial download of the metrics may take a while.