Fig. 1.
Download original image
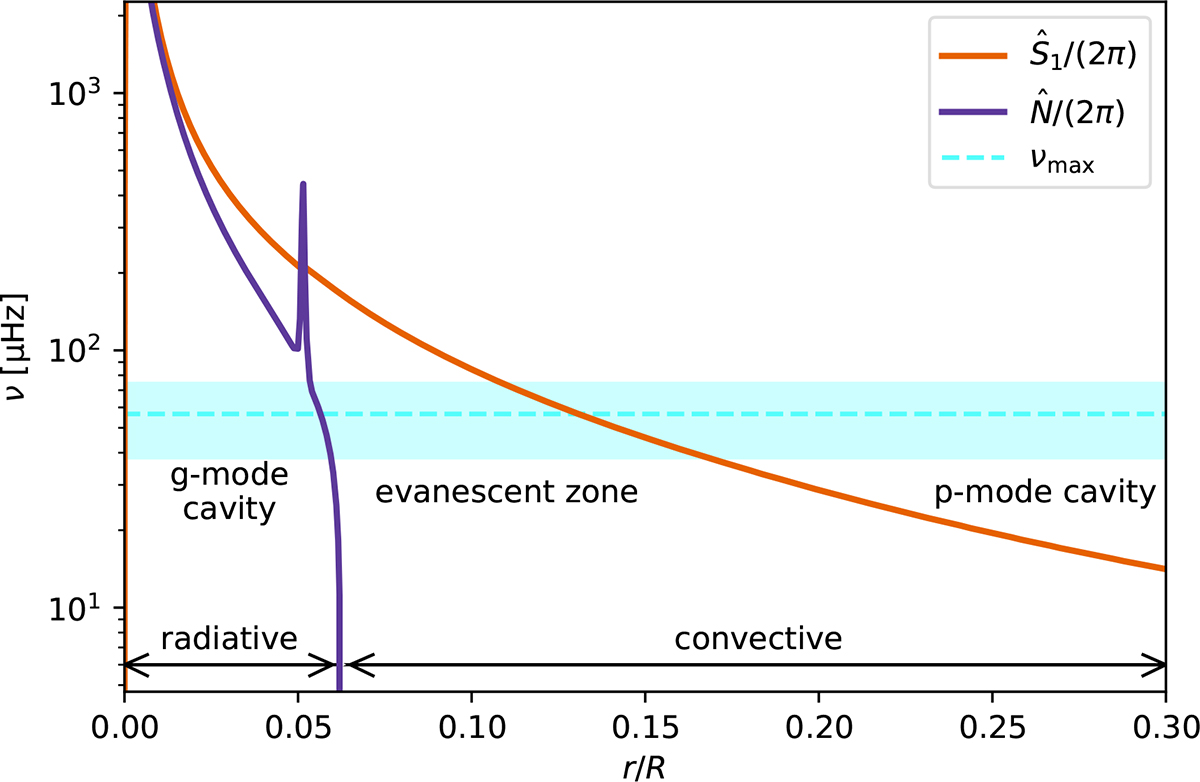
Propagation diagram of the inner 30% of a red giant model with M = 1.25 M⊙, Z = 0.020. Characteristic frequencies ![]() (orange) and
(orange) and ![]() (purple) as a function of fractional radius. The dashed blue line and shaded area show the value of νmax and the range of dipole mode frequencies used in the analysis. In the g-mode cavity of a mode, its frequency lies below and in the p-mode cavity, it lies above the two characteristic frequencies. Where
(purple) as a function of fractional radius. The dashed blue line and shaded area show the value of νmax and the range of dipole mode frequencies used in the analysis. In the g-mode cavity of a mode, its frequency lies below and in the p-mode cavity, it lies above the two characteristic frequencies. Where ![]() , the mode evanesces. The chemical discontinuity caused by the first dredge-up (i.e., the spike in
, the mode evanesces. The chemical discontinuity caused by the first dredge-up (i.e., the spike in ![]() ) is located just below the evanescent zone of the maximum sampled frequency in this model.
) is located just below the evanescent zone of the maximum sampled frequency in this model.
Current usage metrics show cumulative count of Article Views (full-text article views including HTML views, PDF and ePub downloads, according to the available data) and Abstracts Views on Vision4Press platform.
Data correspond to usage on the plateform after 2015. The current usage metrics is available 48-96 hours after online publication and is updated daily on week days.
Initial download of the metrics may take a while.