Fig. 7.
Download original image
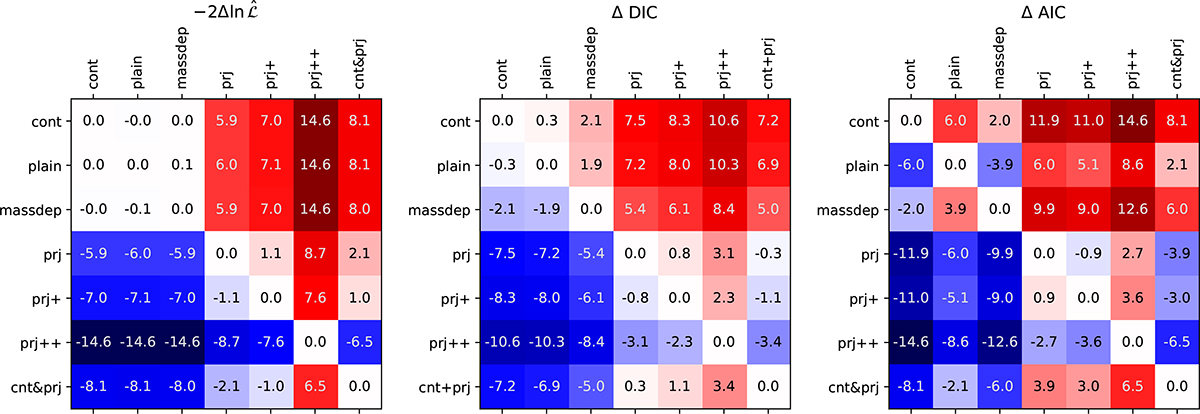
Model comparison metrics (from left to right: maximum likelihood, deviance information criterion, Akaike information criterion) for the different models we considered (prj: projection effects, cont: contamination, mass dep: mass-dependent scatter, prj+: projection effect with free amplitude, prj++: projection effects with free amplitude, richness and redshift trends, prj+cont: projection effects with contamination). Each entry is the difference between the model in the row and the model in the column. Negative values (in blue) mean that the model in that the row is preferred.
Current usage metrics show cumulative count of Article Views (full-text article views including HTML views, PDF and ePub downloads, according to the available data) and Abstracts Views on Vision4Press platform.
Data correspond to usage on the plateform after 2015. The current usage metrics is available 48-96 hours after online publication and is updated daily on week days.
Initial download of the metrics may take a while.