Fig. 1.
Download original image
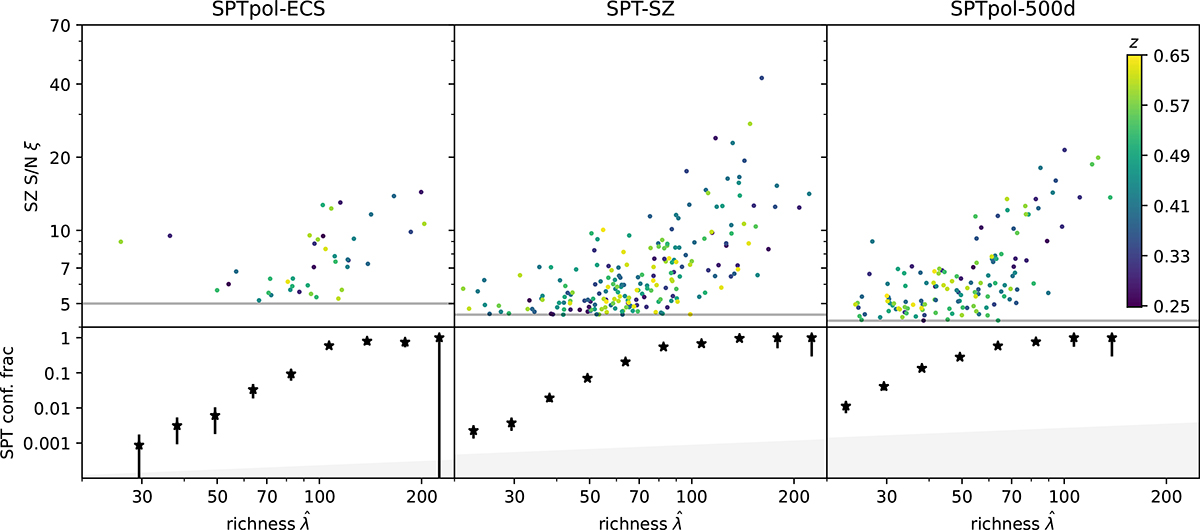
Upper panels: Distribution in richness ![]() and SZe signal-to-noise ξ of the redMaPPer clusters matched by SPT, (color-coded by redshift; see color bar at right). We split this into three surveys with different SZe detection limits (the gray lines) and varying depth. Lower panels: Fraction of redMaPPer clusters confirmed by SPT in the three surveys as a function of richness (black points). The gray-shaded area shows the upper limit of the confirmation fraction due to false SPT detections.
and SZe signal-to-noise ξ of the redMaPPer clusters matched by SPT, (color-coded by redshift; see color bar at right). We split this into three surveys with different SZe detection limits (the gray lines) and varying depth. Lower panels: Fraction of redMaPPer clusters confirmed by SPT in the three surveys as a function of richness (black points). The gray-shaded area shows the upper limit of the confirmation fraction due to false SPT detections.
Current usage metrics show cumulative count of Article Views (full-text article views including HTML views, PDF and ePub downloads, according to the available data) and Abstracts Views on Vision4Press platform.
Data correspond to usage on the plateform after 2015. The current usage metrics is available 48-96 hours after online publication and is updated daily on week days.
Initial download of the metrics may take a while.