Fig. A.3.
Download original image
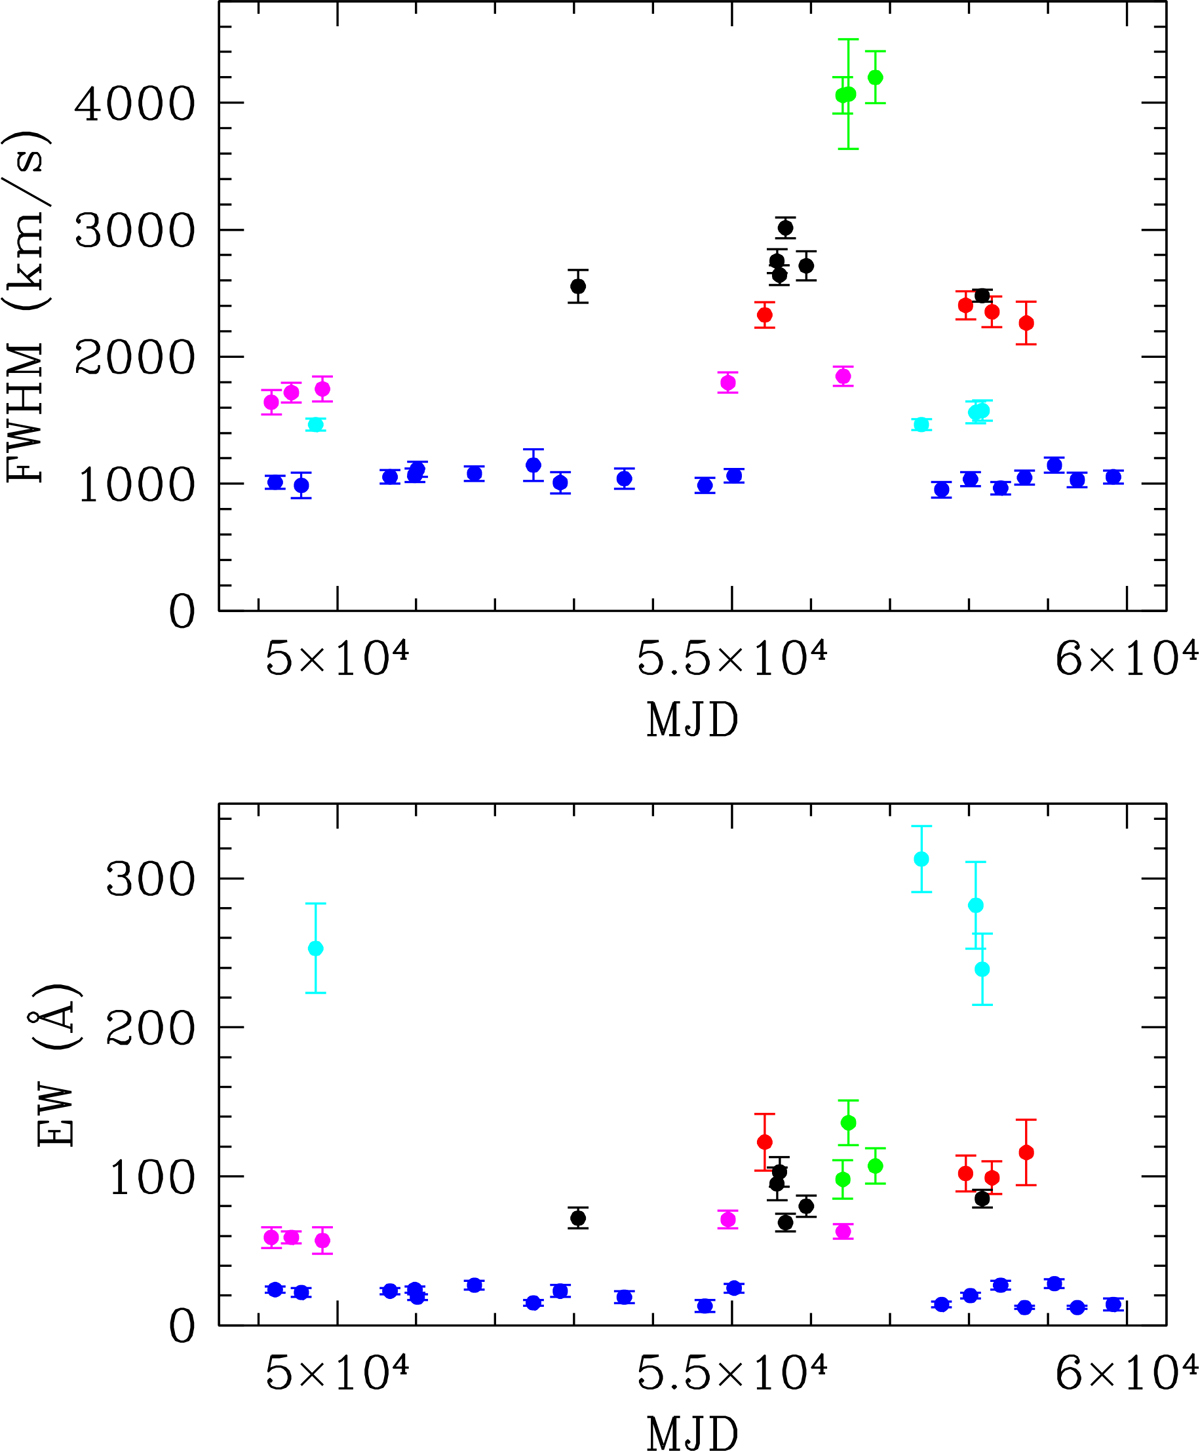
Long-term (secular) variation of FWHM and EW in a sample of quiescent BH XRTs. The plot covers a period of 30 years. Every point represents an orbital average over a single epoch. The color code is as follows: blue (V404 Cyg), cyan (GRO J0422+32), magenta (N. Mus 91), red (XTE J1859+226), black (XTE J1118+480) and green (SWIFT J1357.2-0933).
Current usage metrics show cumulative count of Article Views (full-text article views including HTML views, PDF and ePub downloads, according to the available data) and Abstracts Views on Vision4Press platform.
Data correspond to usage on the plateform after 2015. The current usage metrics is available 48-96 hours after online publication and is updated daily on week days.
Initial download of the metrics may take a while.