Open Access
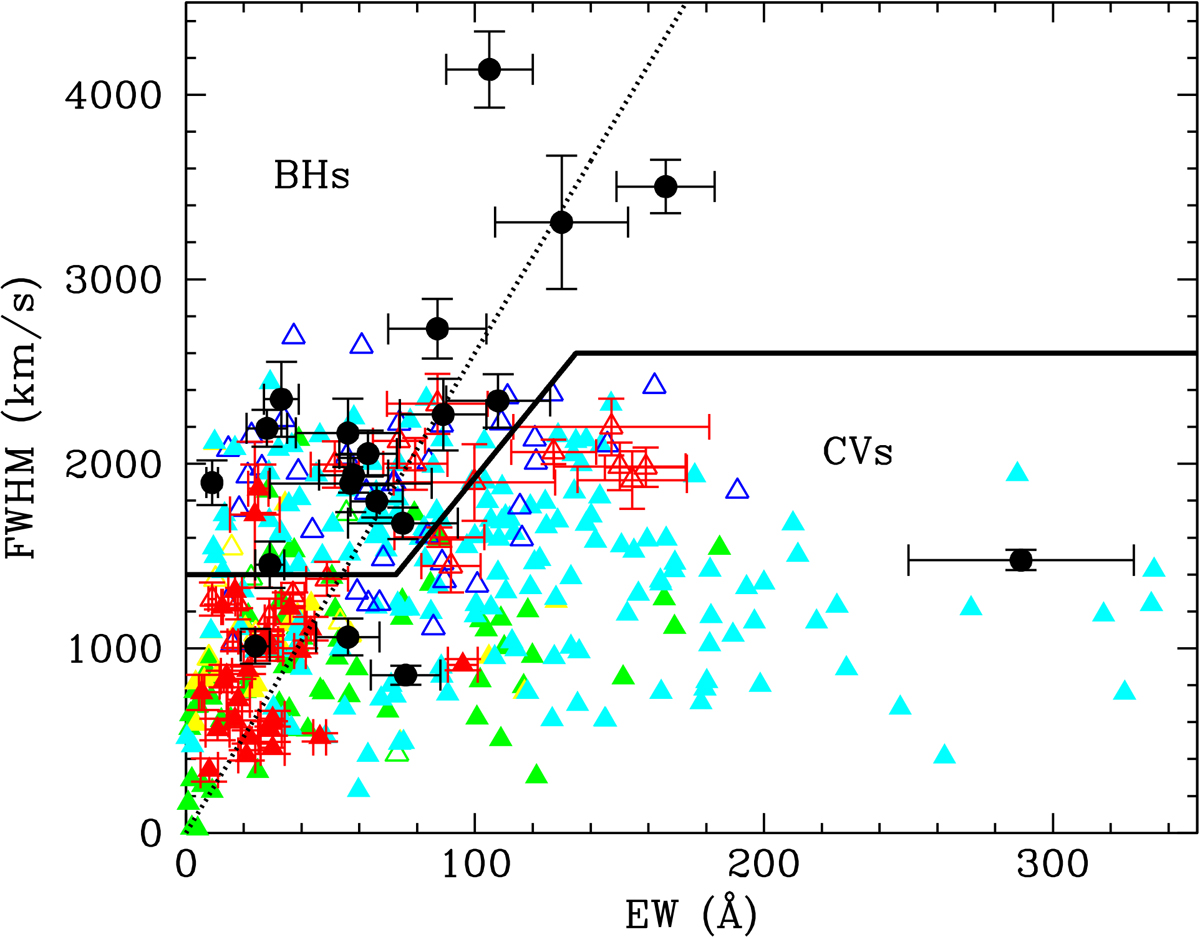
Fig. 5.
Download original image
Distribution of BHs and CVs in the FWHM-EW plane. The BH clustering line at FWHM = 26 × EW is indicated by dots, while the solid line marks our Fig. 4 cuts for optimal BH selection.
Current usage metrics show cumulative count of Article Views (full-text article views including HTML views, PDF and ePub downloads, according to the available data) and Abstracts Views on Vision4Press platform.
Data correspond to usage on the plateform after 2015. The current usage metrics is available 48-96 hours after online publication and is updated daily on week days.
Initial download of the metrics may take a while.